|
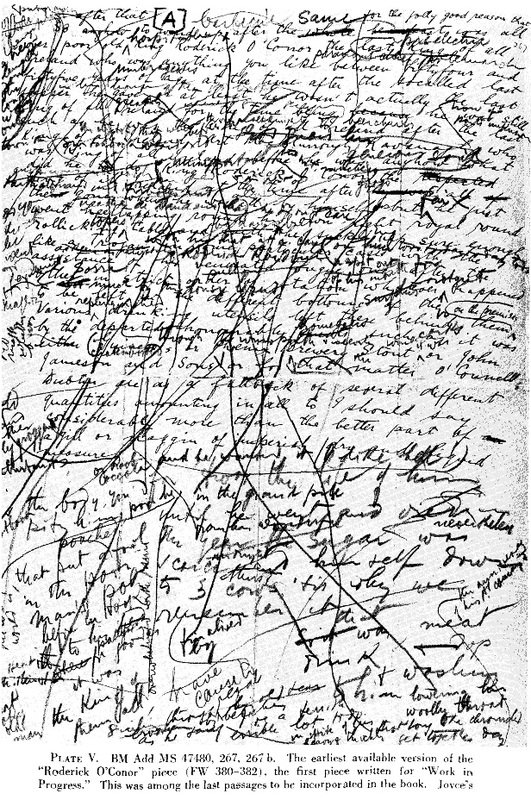
❉ This is the seventh in a series of blogs that discuss diagrams in the arts and sciences. I recently completed my PhD on this subject at Kyoto city University of the Arts, Japan's oldest Art School. Feel free to leave comments or to contact me directly if you'd like any more information on life as an artist in Japan, what a PhD in Fine Art involves, applying for the Japanese Government Monbusho Scholarship program (MEXT), or to talk about diagrams and diagrammatic art in general. Figure 1: The earliest surviving draft of James Joyce's "Roderick O'Conor" piece, covered in Joyce's own revisions, from David Hayman's A First Draft Version of Finnegans Wake. Literature and literary texts aren't normally associated with diagrams, mainly because of the linear nature of the reading process itself. However non-linear texts with complex narratives, plots and story structures almost automatically become diagrammatic, and rely on a variety of diagrammatic processes to both create and understand them. The illustration above gives a glimpse into the intricate web of ideas created by James Joyce during the writing of his experimental and difficult novel Finnegans Wake, first published in 1939. In one of the most dense and convoluted plots in literary history, readers are left with the impression that events are happening simultaneously thanks to Joyce's use of multiple, interconnected and disjointed narratives. The Irish experimental poet Billy Mills described it as "the book the web was invented for", proposing that by taking in to account music, the act of reading-aloud and contemporary digital technologies we are able to open up rich new interpretations of the text that have much more in common with encyclopedias and web hypertexts than the conventional format of the novel. (1) Mills article can be found here.
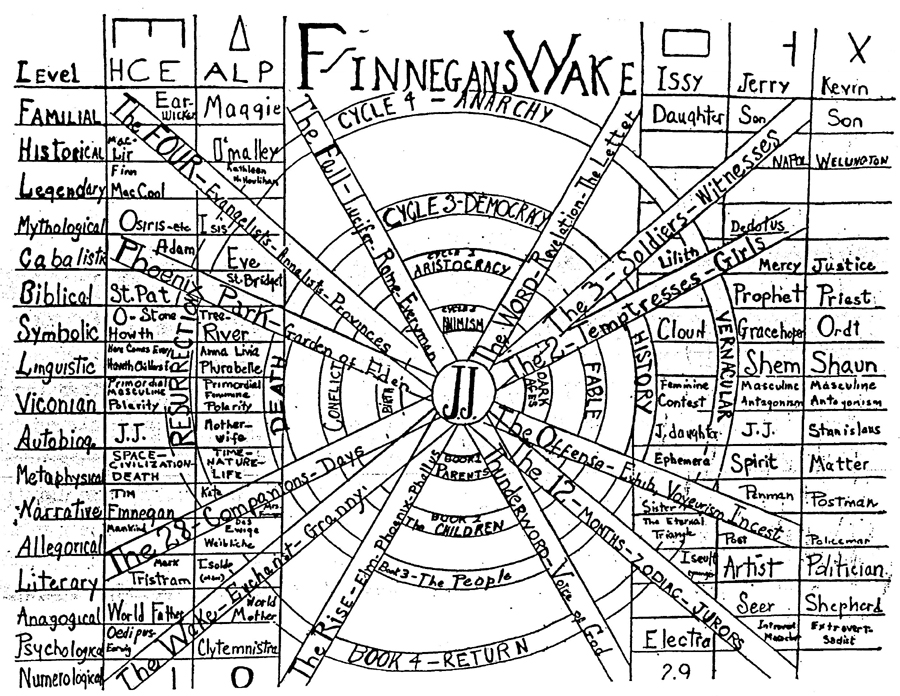
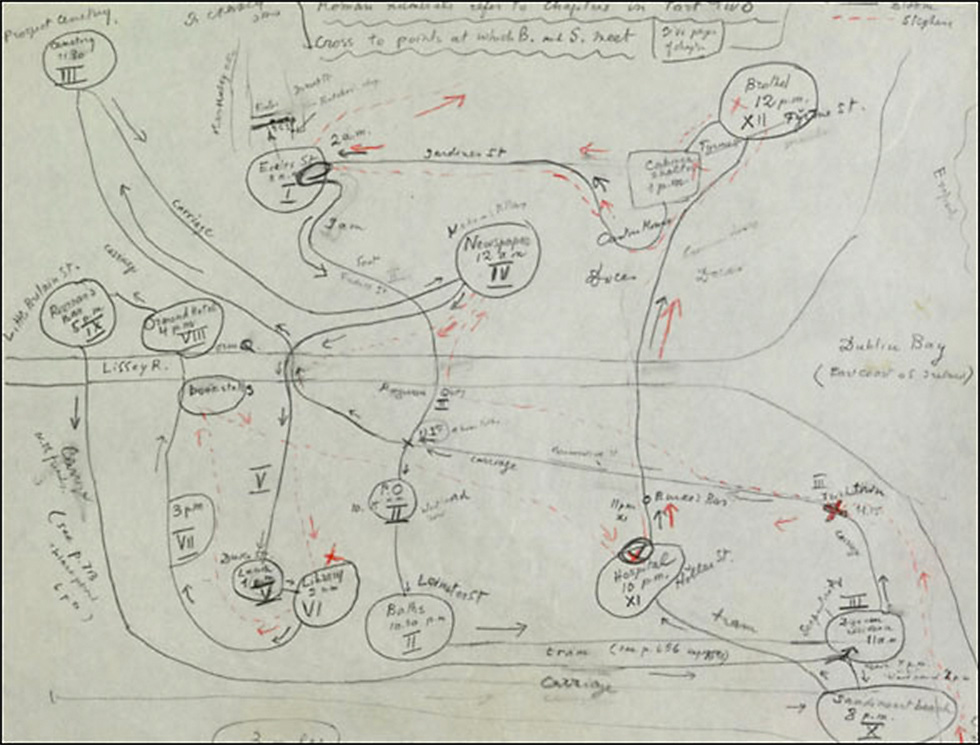
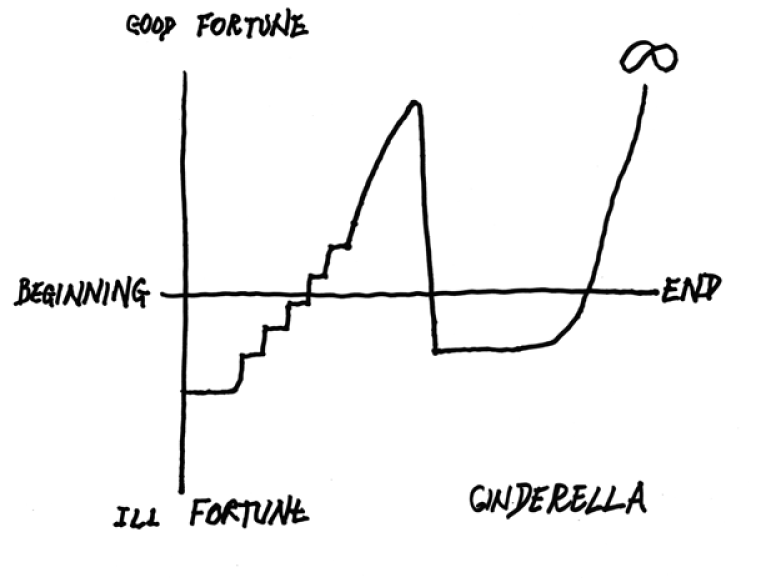
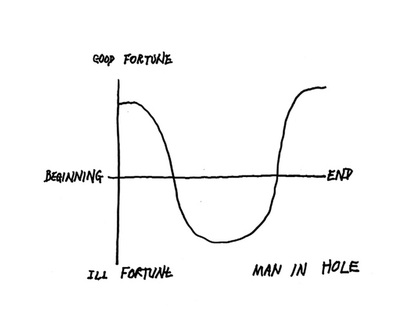
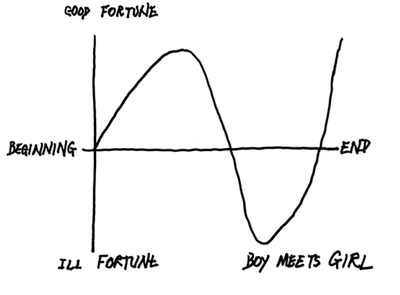
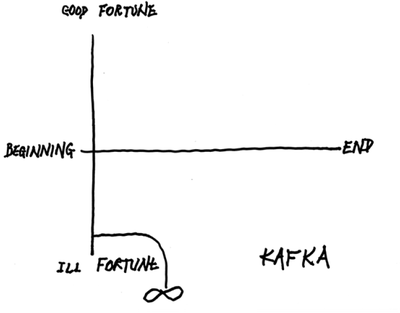
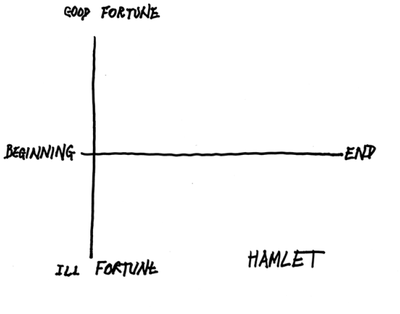
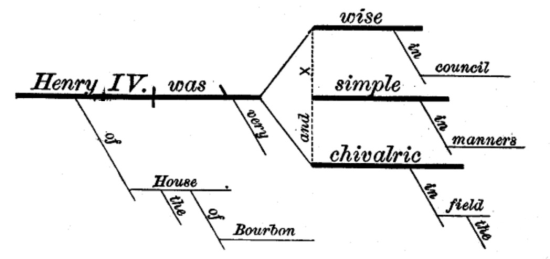
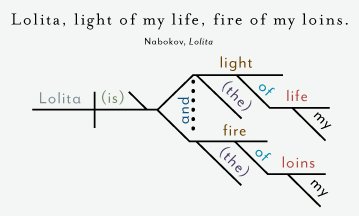
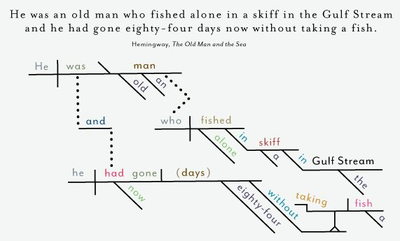
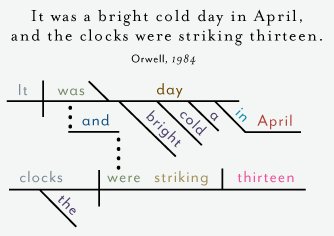
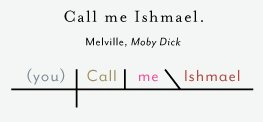
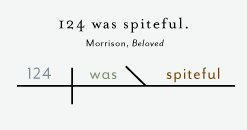
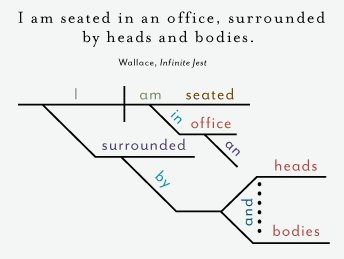
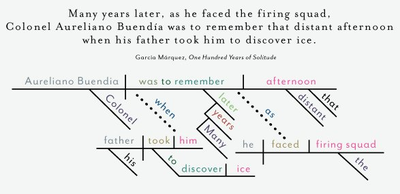
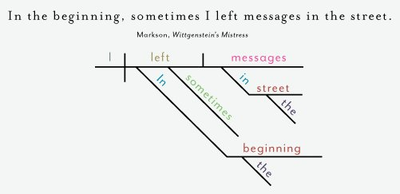
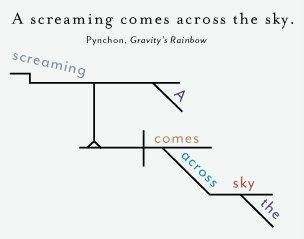
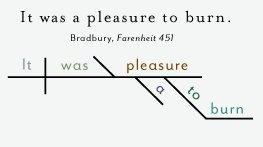
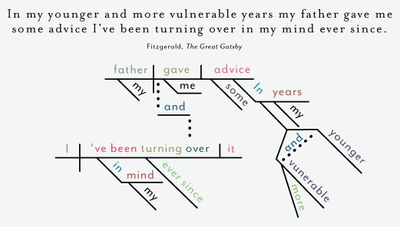
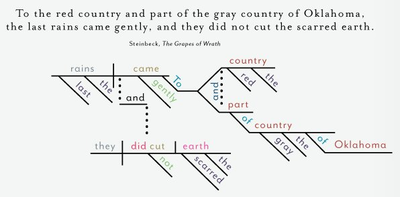
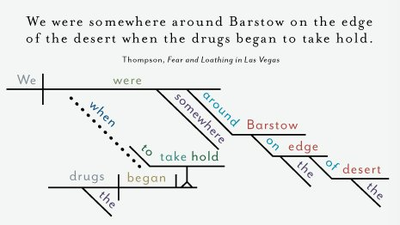
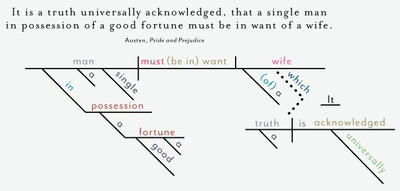
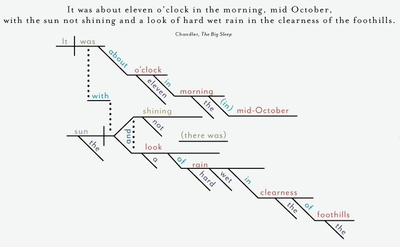
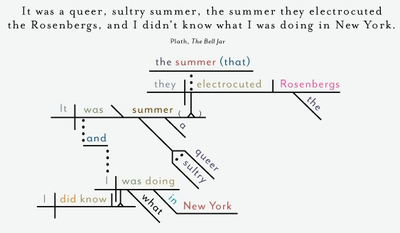
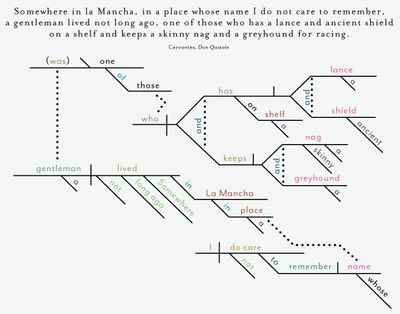
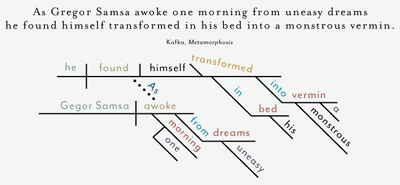
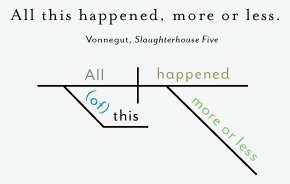
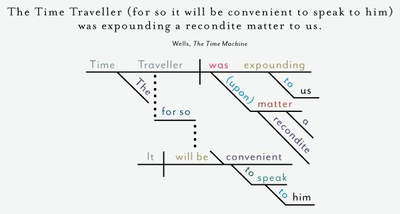
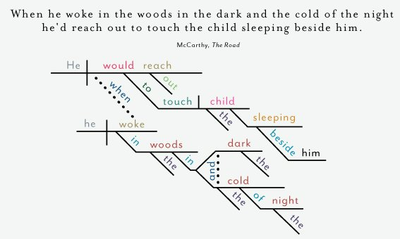
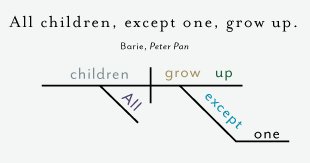
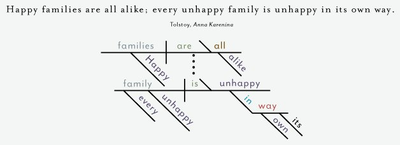
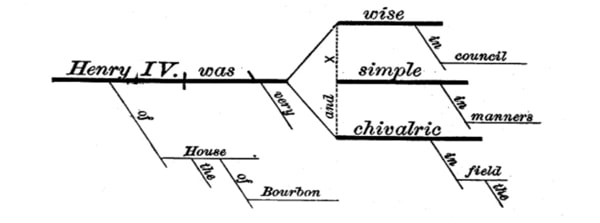
Mills highlights just how important the diagram was to Joyce's work both as an engine of creation and the means by which readers attempt to decode the work and investigate its labyrinth of references, puns and wordplay. An annotated online version of the text can be found here. Figure 2: László Moholy-Nagy's diagram of Finnegan's Wake, 1946, from 'Vision in Motion', Chicago. The Hungarian born artist László Moholy-Nagy, created a diagram of the themes of Finnegans Wake with Joyce (JJ) positioned as the pivotal point of a wheel like structure. The four concentric circles represent Giambattisata Vico's theory of history, and the columns on the left show various 'levels' such as: familial, historical, mythological, cabalistic, biblical, symbolistic, etc. Column headers contain the characters HCE (H.C. Earwicker), ALP (Anna Livia Plurabella) and their children. The spokes of the wheel that pass through the various layers of narrative suggest further interconnections within the text, based upon the signs of the zodiac, the four evangelists and Phoenix park in Dublin etc. It's easy now to imagine an interactive, three dimensional version of Moholy-Nagy's diagram, connecting its users via encyclopedic hyper links to important images, texts and music referenced by Joyce. Figure 3: Vladimir Nabokov's diagram tracking the paths Stephen Dedalus and Leopold Bloom took through Dublin on June 16, 1904, in Joyce's masterwork Ulysees. Vladimir Nabokov detested what he called "Punningans Wake", refering to it as a "cancerous growth of fancy word-tissue" consisting of the "dreadful joviality of the folklore and the easy, too easy, allegory." (3) However Nabokov considered Joyce's novel Ulysees as brilliant, lucid, and some kind of 'Great Machine' (4). Nabokov even went so far as to diagram the route that Stephen Dedalus and Leopold Bloom took through Dublin on June 16, 1904, as part of his lectures notes for Ulysees, and suggested to those who teach Ulysses that: “Instead of perpetuating the pretentious nonsense of Homeric, chromatic, and visceral chapter headings, instructors should prepare maps of Dublin with Bloom’s and Stephen’s intertwining itineraries clearly traced.” If Narrative is taken to be the structure of events — the architecture of the story, and Story is the sequence of events, the order in which the narrative occurs — the tour through the building, then Plot is the sum of the events, told not necessarily in sequential order, but generally consistent with the story and often considered synonymous with the narrative — the building itself. The American novelist Kurt Vonnegut proposed that there are in fact only a very limited number of underlying plots to all of the stories which we tell ourselves, and all can be depicted using simple diagrams. Vonnegut submitted his idea as his 1969 Masters Thesis at the University of Chicago, but it was rejected at the time as being overly simplistic. However Vonnegut persisted with the idea, eventually representing his thesis as a series of lectures, and extract is show in the video below: Figure 5: Kurt Vonnegut lecturing on 'The Shape of Stories' Figure 6: Kurt Vonnegut's diagram of the plot of the story Cinderella, with an x-axis = time, and y-axis = fortune In the case of the story of Cinderella, Vonnegut recognised a deep structural similarity between it and the plot of the new testament. In both cases, the protagonists receive incremental gifts from a spirit or deity, experience a sudden fall from grace, only to rise again to experience off the chart levels of bliss and good fortune. Vonnegut suggested several other distinct patterns that he named 'Man in a hole' (fall-rise), 'Boy meets girl' (fall-rise-fall), 'Kafka' (an infinite fall described by Vonnegut as 'a pessimistic story'), and 'Hamlet', whose situation is the same as Cinderella’s, except that the sexes are reversed. However Vonnegut proposes that Shakespeare's master-piece leaves us uncertain as to what is good and what is bad news, and opts to leave the graph empty. Figures 7-10: Kurt Vonnegut's plot diagrams, first developed in 1949 as part of his Masters Thesis. In order to take a closer look at the structure of literature and thus of text itself, Alonzo Reed and Brainerd Kellogg developed a novel diagrammatic system in the 1860's and 70's, now known as Reed-Kellogg diagrams. As pedagogical tools these diagrams capture a number of important features of sentence structure in a clear visual layout that highlights the core of the sentence and how other elements relate to that core. Figure 11: Sentence diagram from Reed and Kellogg, Graded Lessons in English, p. 60 Reed-Kellogg diagrams make use of font size, line weight and angle and a number of other codes which must be learnt in order to decipher their meaning. They were by no means the first or most definitive system to dissect and display grammar for educational purposes, and modern linguistics also uses tree-diagrams to analyse sentence structure. The Reed-Kellogg method, however, provides a compact and aesthetically pleasing diagrammatic means of breaking down sentence components for educational analysis, and the following are a series of opening sentences from famous novels, compiled by the infographics company 'Pop Chart Lab', titled “A Diagrammatical Dissertation on Opening Lines of Notable Novels.” More information is available at popchartlab.com References:
1)Billy mills, Finnegans Wake – the book the web was invented for, Online: The Guardian, April 28th, 2015. (Available here) 2)Ibid. 3) Vladimir Nabokov in interview: http://www.theparisreview.org/interviews/4310/the-art-of-fiction-no-40-vladimir-nabokov 4) Ibid.
4 Comments
Hi Michael,
Reply
To me literature is an amazing subject that celebrates the entire art course.its simple yet complex nature awe and scares me.it is unique to life approach and it celebrates the mystery wrapped around culture.i love literature because it helps one to learn of the various culture and style of other countries. If you are looking for an amazing site to get more information, then I have what you need. <a href="https://naijschools.com/art-courses-without-literature-in-english/">This link</a> would grant you access to interesting articles that would be very useful and informative to you, and I would appreciate it if you visit my site. Many thanks.
Reply
Your comment will be posted after it is approved.
Leave a Reply. |
Dr. Michael WhittleBritish artist and Posts:
Categories
All
Archives
April 2024
|
