|
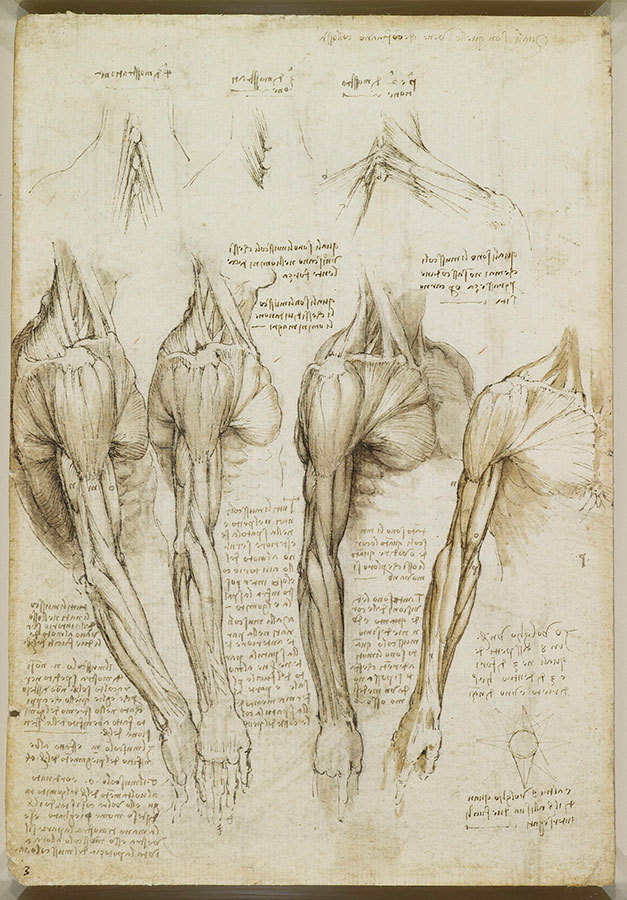
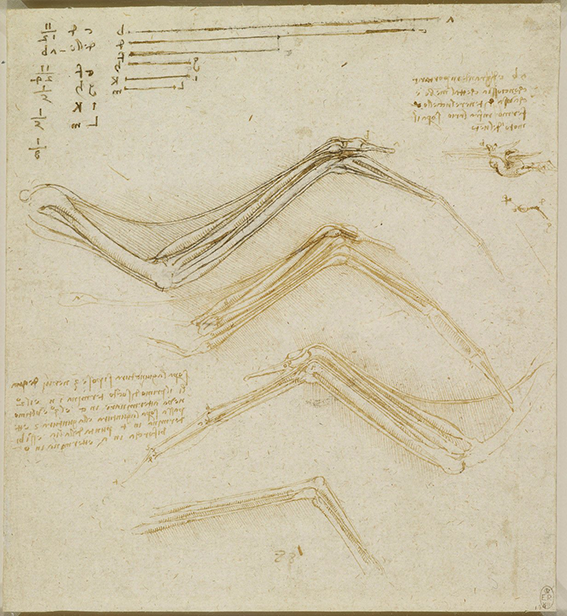
❉ Blog post 20 on diagrams in the arts and sciences delves in to Leonardo Da Vinci's life long obsession with diagram making. From documenting ideas and observations, to elaborate mechanical instructions, blueprints for buildings and sketches for paintings, the diagram was the creative engine that drove his endless pursuit of knowledge and understanding. 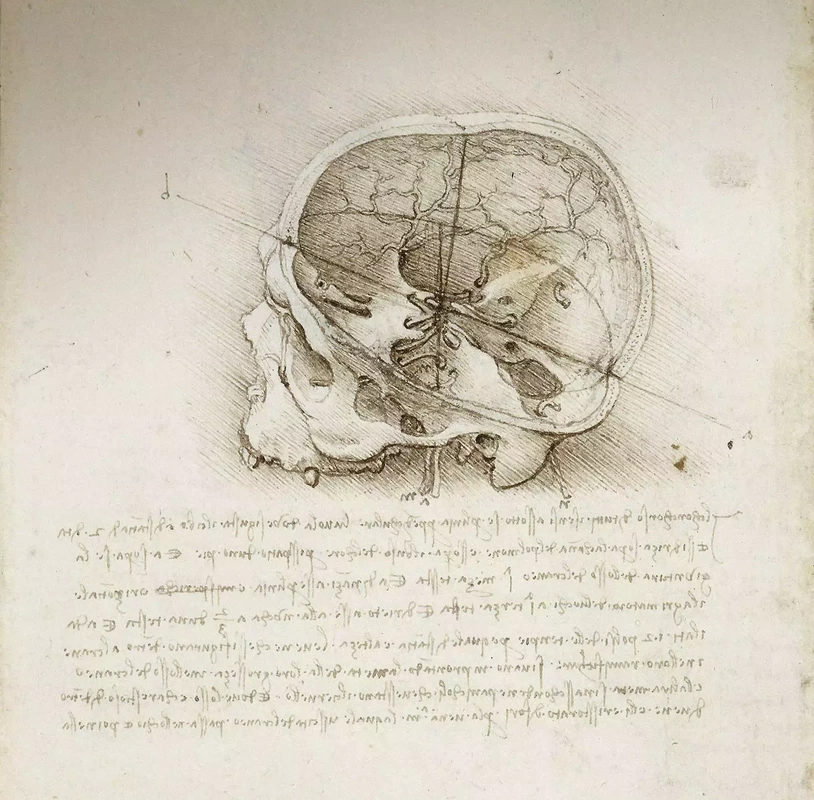 1) Glimpse into the left side of a human skull, about 1651 © Royal Collection Trust / Her Majesty Queen Elizabeth II (CC BY-NC-SA 4.0) The surviving notebooks of early Renaissance artist and polymath Leonardo da Vinci (1452-1519) reveal a masterful fluency in his use of diagrams. Indeed, during certain periods, his distinctive mirror-written notes and diagrammatic sketches were his medium of choice for observing and analysing the world, rather than drawing and painting. However as we'll see, all of these modes of exploration and expression were intimately connected, especially so in the case of his complex preparatory diagrams that underlie some of his major paintings. Geometry was fundamental to Leonardo’s process of understanding both the visible forms of nature and the hidden mechanisms and forces underlying natural phenomena. His vision of the interplay of these rules of geometry was transformative and dynamic rather than static, as if he observed nature as a process of geometry in action. He was however not merely content to record how something worked, but also strove to find out why it worked the way it did, and it was this insatiable curiosity that transformed a technician into a scientist. (1) In the words of the great da Vinci scholar Martin Kemp, for Leonardo, the "...muscles of the human body worked immaculately according to the laws that governed levers. The flow of the blood in the vessels and of the air in the bronchial tubes in the lungs was governed by the geometrical rules that applied to all branching systems. A flying bird was designed in perfect conformity with the geometry of airflow.” (2) (See figures 2-5)
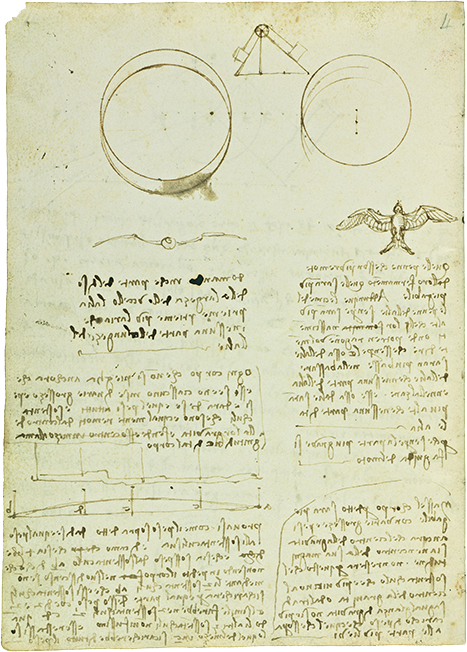
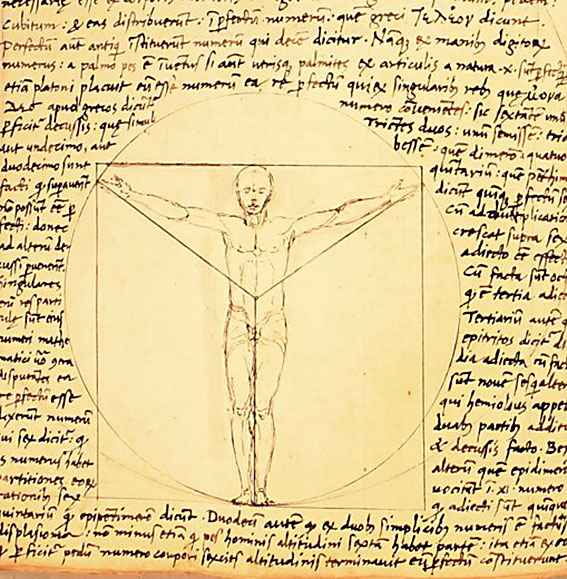
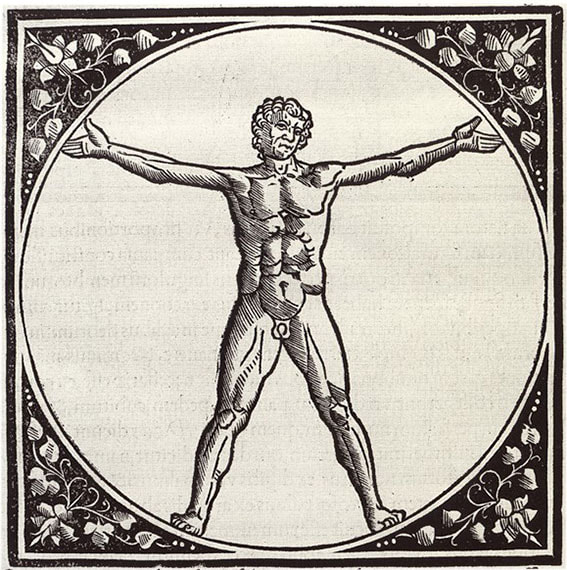
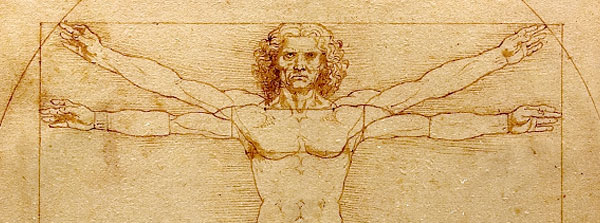
Leonardo studied anatomy and the proportions of the human body throughout his career, and applied this deep understanding in drawings such as The Vitruvian Man (c.1490) (figure 6). This diagrammatic sketch was Leonardo's attempt to answer an ancient puzzle set 1500 before his time by the first century Roman architect and engineer Marcus Vitruvius Pollio (c. 75–25 BCE). In his book De Architectura, Vitruvius founds his theory of architecture on the proportions of the human body, which he considered nature’s greatest work. The challenge was to show how the human figure can be positioned within a circle and a square with the navel at the centre. Ancient thinkers had long invested the circle and the square with symbolic powers, with the circle representing the cosmic and the divine, and the square the earthly and the secular. Leonardo's elegant solution was to position his figure so that the navel aligned with the centre of the circle, but then to position the square off-centre in alignment with the base of the circle. (figure 6) 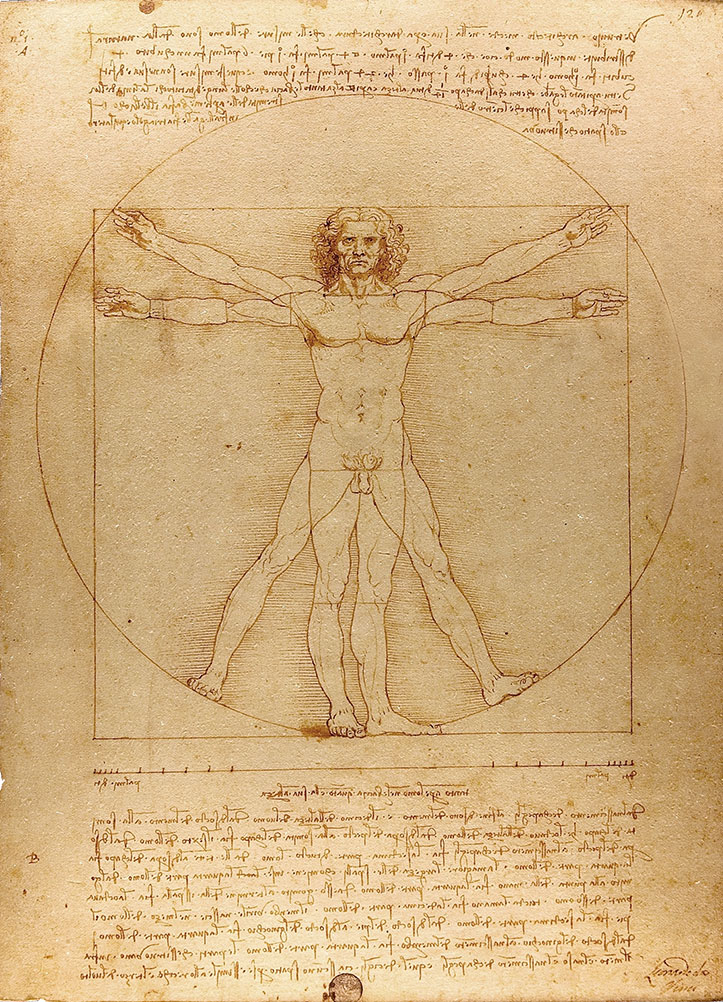 6) The Vitruvian Man, c. 1490 Pen and ink with wash over metalpoint on paper, 34.6 cm × 25.5 cm Interestingly, a number of other artists from around the same period also attempted solutions to the Vitruvian puzzle, and some comparative examples are included below that highlight the refined technical elegance of Leonardo's draftsmanship and his exceptional knowledge of anatomy. One drawing in particular, made by Leonardo's close friend Giacomo Andrea Da Ferrara, actually predates that of Leonardo's, and its rediscovery in a lost manuscript in Ferrara, Italy in 1986, lead some art historians to question whether or not Leonardo's drawing was actually of copy of his friend's solution. (3) (See figure 9) 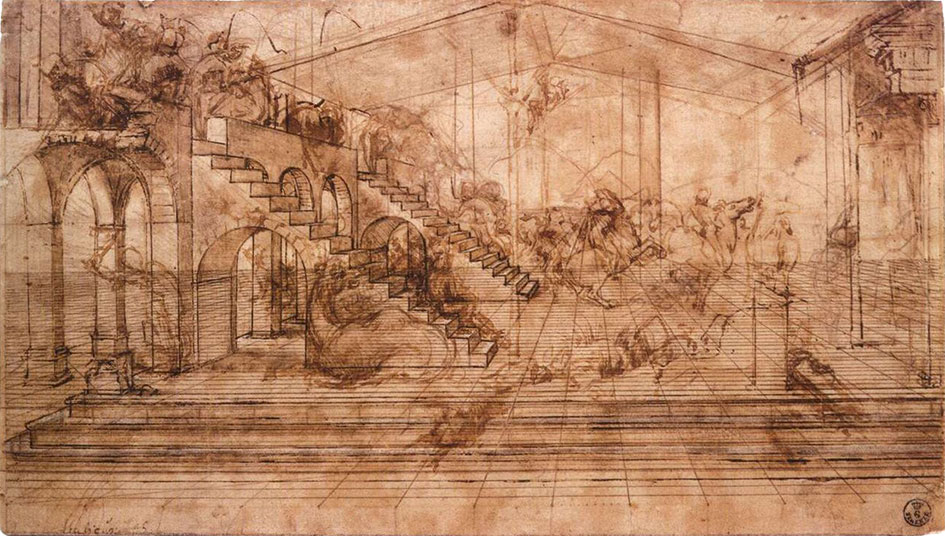 7) Perspective study for the adoration of the Magi, c. 1481 Ink on paper, 16.3 x 29 cm, Florence, Galleria degli Uffizi Leonardo’s preparatory study for the adoration of the Magi is one of his most remarkable sketches. (figure 7) The immaculately depicted geometry of the tiled floor and the static architecture of the temple interior highlight the turbulent graphic images of the figures and animals depicted within it. British art historian Kenneth Clark described the drawing as "a carefully measured courtyard invaded by a retinue of ghosts". Clark considered it one of Leonardo's most revealing drawings, and the earliest evidence of his scientific attainments in perspective, which to his mind provided "a scaffold for the artist's imagination." (4) Likewise, Martin Kemp considers the sketch an exemplar of the paradoxical combination of contained measure and unconstrained improvisation characteristic of many of Leonardo’s drawings. (5) The reduction of complex natural forms to their underlying geometrical relations was, however, more of an intuitive process for Leonardo than one relying upon the techniques of mathematics. Kemp has suggested that this preference may have been two-fold, both in Leonardo’s own limited abilities at mathematics and algebra but also as an intellectual preference for a more fluid model of a dynamic world based on the beauty of proportions, interrelations and first-hand experience of the world. Leonardo referred to geometry as “the science of continuous quantity’” whereas he referred to numbers and mathematics as dealing with “discontinuous quantities” with little correspondence to the nature of actual physical forms. (6) In his essay for the book accompanying the 2006 exhibition 'Leonardo da Vinci: Experience, Experiment and Design' at the Victoria and Albert museum in London, Kemp discusses Leonardo’s use of disegno as a means to think visually. Disegno was a common term used by Renaissance draughtsmen and is normally translated in English as either drawing (in a fine art context) or design (in the context of applied arts). Leonardo’s use of disegno allowed him to integrate the subjective imaginative faculty or fantasia with the intellect, which in turn achieved expression in the Renaissance concept of science (scientia). Misura was the term used to describe the measuring of proportions, the construction of perspective systems and rules of light and shade, and was regarded by Leonardo as the fundamentally scientific aspect of expression in painting. (7) In works such as the Perspective study for the adoration of the Magi (figure 6), we can see this process at work in the way he combines the fluid, creative, subjective process of disegno with the logic, rigor and measurement of misura. Kemp uses the following quote from Leonardo to support his claim that disegno was considered as the supreme tool that served the eye as a means of investigation and exposition. When Leonardo praises how the eye commands the hand, Kemp suggests that he was essentially making claims about the power of disegno: "Now do you not see that the eye embraces the beauty of the world? The eye is commander of astronomy; it makes cosmography; it guides and rectifies all the human arts; it conducts man to various regions of the world; it is the prince of mathematics; it’s sciences are most certain; it has measured the height and size of the stars; it has disclosed the elements and their distributions; it’s made predictions of future events by means of the course of the stars; it has generated architecture, perspective and divine painting. Oh excellent above all other things created by God… And it triumphs over nature, in that the constituent parts of nature are finite, but the works that the eye commands of the hands are infinite." (8)  8) Codex Arundel, circa 1480 - 1518 (See below for a link to a digitised version) However, it's immediately notable that the systems Leonardo is praising, all relate to the power of diagrams, diagramming, and diagrammatic thought processes, and this becomes even clearer if we consider the examples he refers to: astronomy and celestial charts, the theory and practice of the systems of proportions governing artistic beauty, cosmography (9), cartography and navigation, mathematics including trigonometry and geometry, the analysis of dynamic and static systems in the behavior of earth, water, air and fire, architectural plans, elevations, sections and systems of perspective and the ‘divine’ science of painting with its ‘roots in nature’. Drawing and thinking through diagrams was for da Vinci a natural, almost instinctual means to develop his ideas, communicate them with others and construct a science of painting. However, as with other artists of the Renaissance, Leonardo inherited the tradition for diagramming from Medieval diagrammers before him, as I covered in previously blog posts: Diagrams from the Dark Ages, and Cosmic Diagrams from Alchemical Laboratory. Leonardo's online Codex:Leonardo's Codex Arundel consists of 570 images of dense cryptic notes surrounding technical diagrams. The 283 page manuscript was digitized in 2007 as a joint project between the British Library and Microsoft called “Turning the Pages 2.0,” and can be accessed by clicking here. The Alternative Vitruvian Men: |
 10) Fra Giovanni Giocondo, 1511 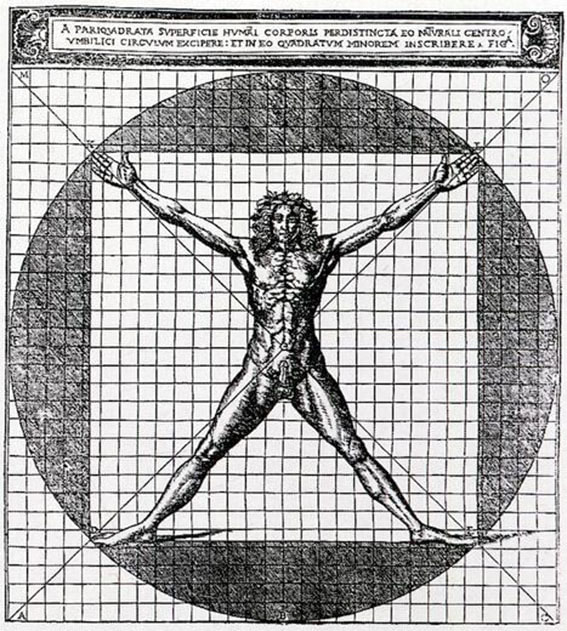 12) Cesare di Lorenzo Cesariano | 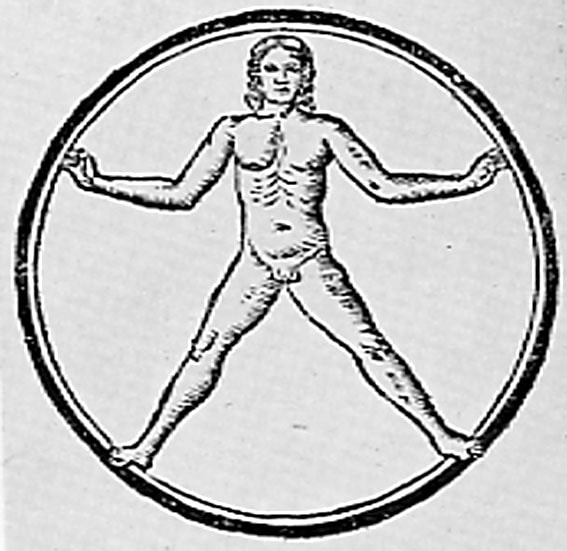 11) Francesco Giorgi, 1525 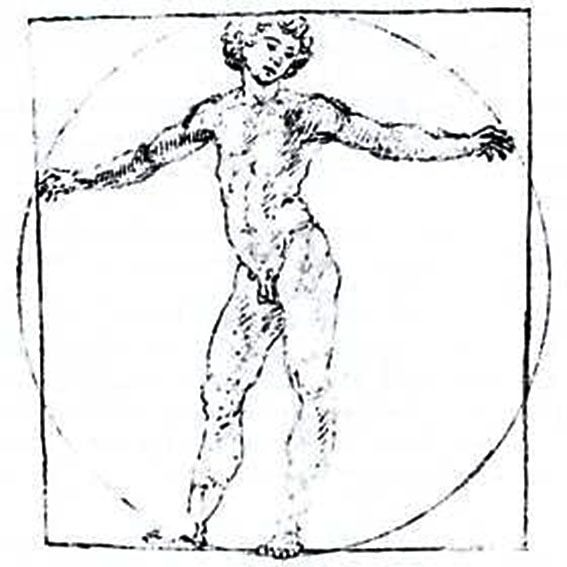 13) Francesco di Giorgio Martini, 1470 |
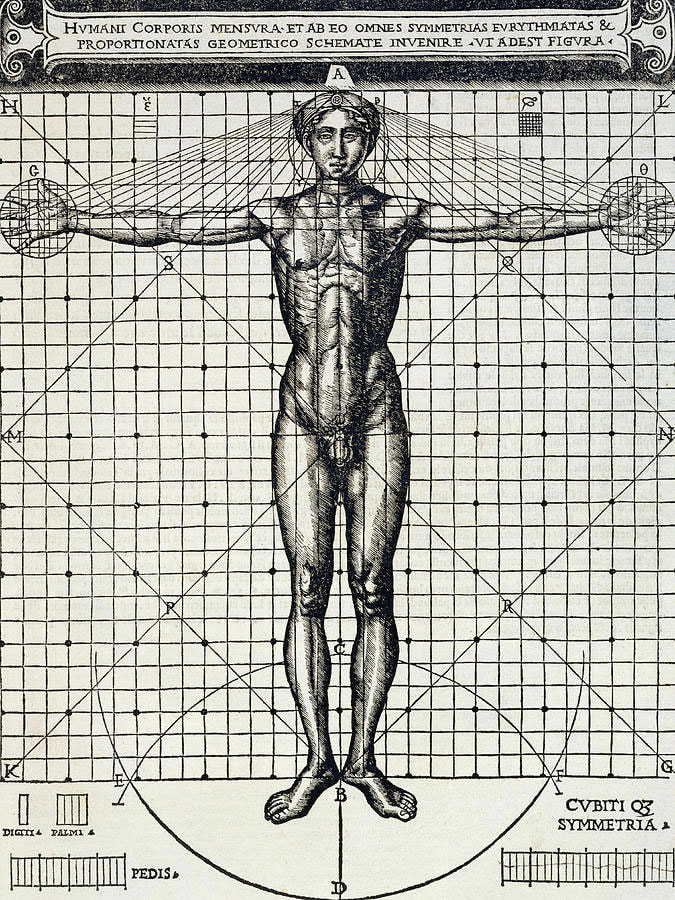 14) Cesare de Lorenzo Cesariano, 1521 | 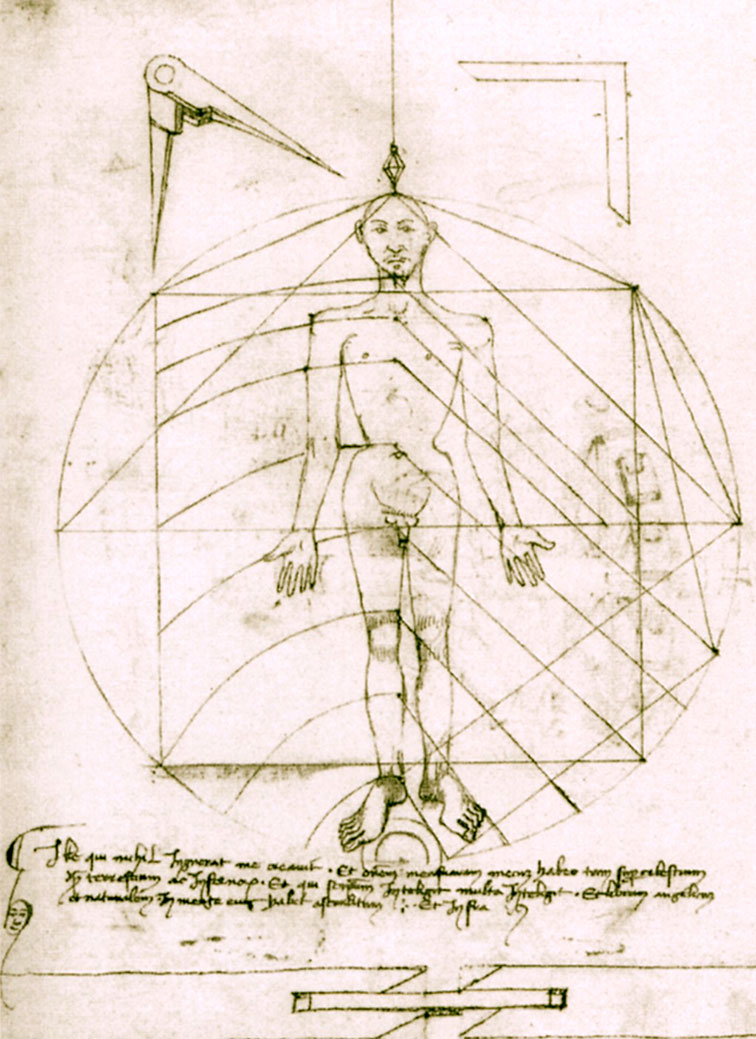 15) Mariano di Jacopo (Taccola), c. 1382-1453 |
References and Notes:
1) Kenneth Clark, (1973). Leonardo Da Vinci, Penguin Books, UK, pg 39
2) Martin Kemp, (2007). Leonardo da Vinci: Experience, Experiment and Design. London: V&A Publications. pg 14
3) Claudio Sgarbi, (2012). At the Origin of Leonardo’s Ideal Man. DISEGNARECON, 5(9),
pg 177–186. https://doi.org/10.6092/issn.1828-5961/3166
4) Kenneth Clark, (1973). Leonardo Da Vinci, Penguin Books, UK, pg 39
5) Da Vinci, Leonardo, quoted in: Kemp, M. (2007) Leonardo da Vinci: Experience, Experiment and Design. London: V&A Publications. pg 96
6) Ibid. pg 23
7) Ibid. pg 18
8) Ibid. pg 96
9)Cosmography was considered a science between the fifteenth and seventeenth centuries,
attempting to map the general features of the cosmos or universe, describing both heaven
and earth (but without encroaching upon geography or astronomy).
0 Comments
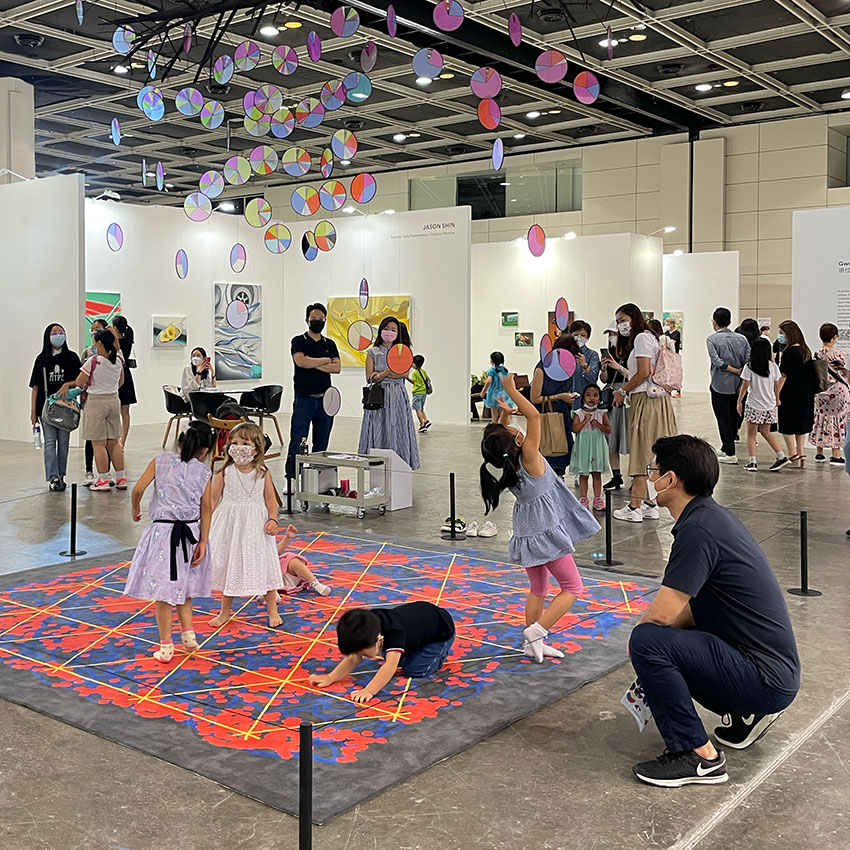
❉ Blog number 19 on diagrams in art and culture covers a recently completed installation for the Yi Tai Sculpture and Installation projects curated by Andre Chan for Hong Kong's 2021 Art Central.
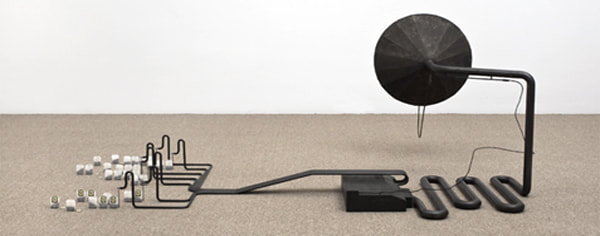
Figure 1: Perpetual Motion (installation view), 2021, Yi Tai Projects, Hong Kong Art Central
Mapping Movement
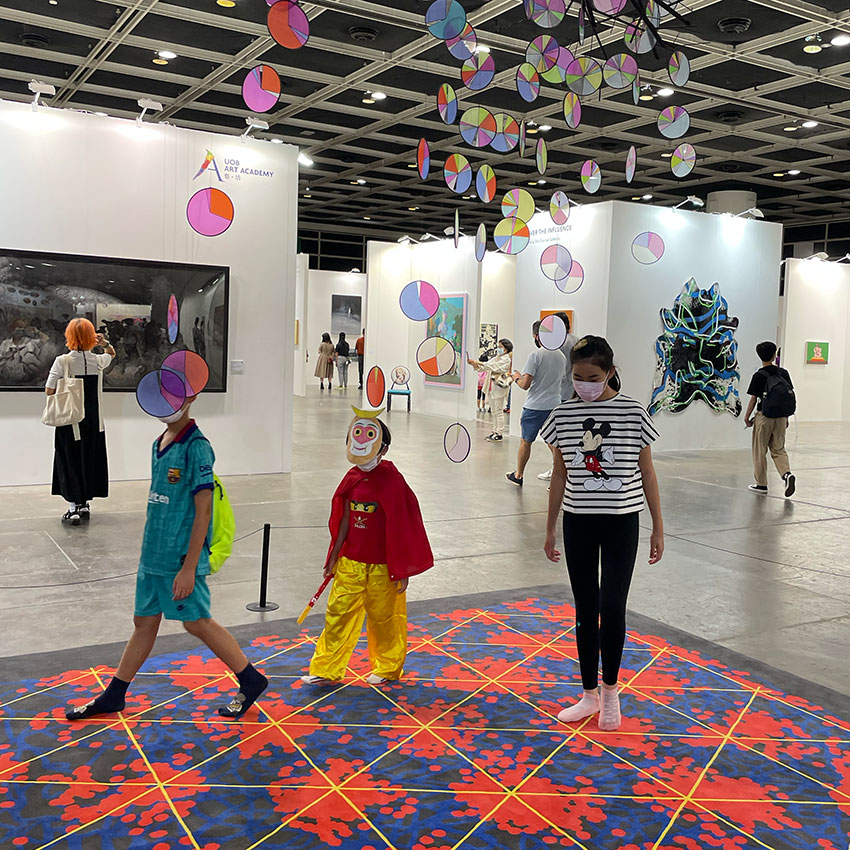
Perpetual Motion was created for Yi Tai Sculpture & Installation Projects, curated by Andre Chan for Art Central Hong Kong in 2021 (Figure 1). The initial ideas for the project were sketched out in the midst of the global Covid-19 pandemic, during mandatory quarantine in a hotel room in Hong Kong, in January of 2021.
I had flown in from Osaka on an empty evening flight and transferred by shuttle bus to my hotel. Once signed in I was guided along corridors lined with security cameras to a room with bay windows overlooking the city. I unpacked and tried to mentally prepare myself for the next 21 days confined to a 24 square metre space (258 ft² ). The subjects I chose to focus on for the installation were movement and location, which seemed timely during a period of worldwide travel restrictions, lengthy quarantines and social distancing.
In a previous project I'd explored the molecular and evolutionary origins of organic movement, and this involved studying Actin and Myosin, two types of specialised motor-proteins found in all types of muscle cells. International research groups had mapped out the structural relationships amongst these two ancient super-families of molecules, and I used their findings to build my own 3D computer models of these molecular family trees, which were then used to create a drawing.
'Model for the origins of movement' depicts the branching, diagrammatic lineages of actin and myosin as fragile interlinked tori floating in an empty white space (figure 2).
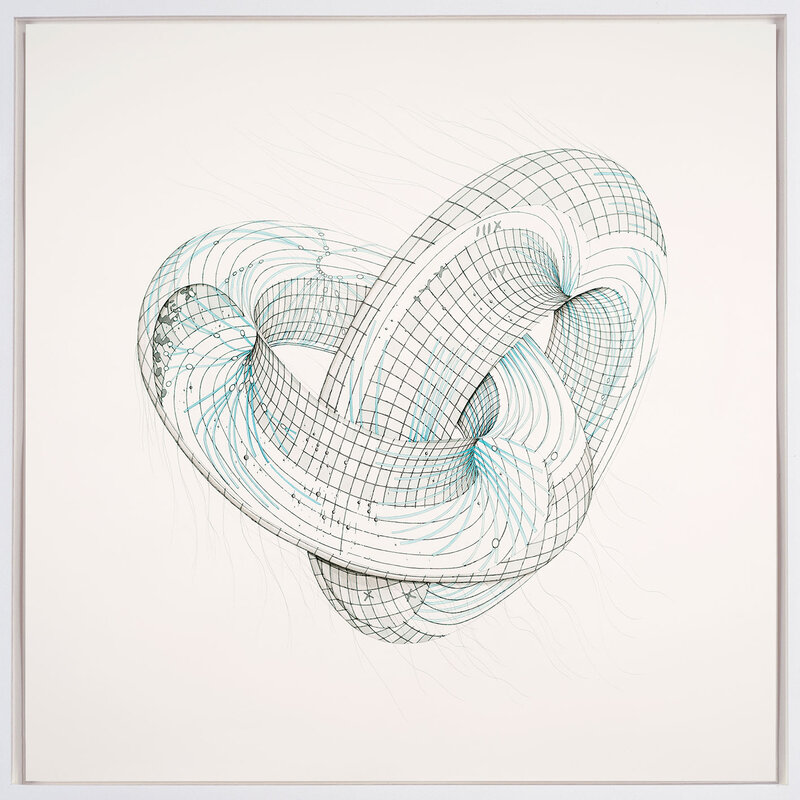
Figure 2: Model for the origins of movement (Myosin and Actin molecular family trees as linked, punctured tori)
2017, 124 x 124 cm, Ink and watercolour on paper
2017, 124 x 124 cm, Ink and watercolour on paper
The process of creating this work is described in greater detail in the article "Portraits of thought: Transfiguring the diagrams of science", written for Intellect Book's "Drawing: research, theory, practice" (1). A link to the Journal is here. Links to the original research papers on Actin and Myosin can be found in the references below (2,3)
Like 'Model for the Origins of Movement', the installation 'Perpetual Motion' incorporates concepts and theories from scientific studies of movement, but also location, and it sets in contrast the different ways these notions are being explored in contemporary science.
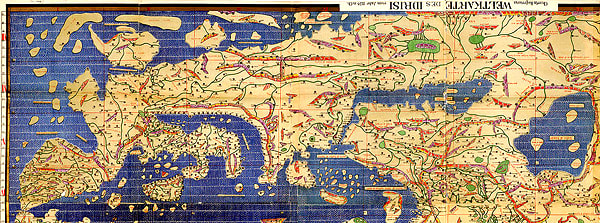
The first research project to catch my attention was a visual digest of cutting edge genetic studies that plot historical global patterns in human genetic variation. The resulting world-maps provide a snap-shot of our current understanding of genetic similarities and differences between male and female population groups, and also reveal the routes taken by our prehistoric ancestors on their journey out of Africa.
Another discovery I was immediately drawn had proven to be such a major breakthrough in the neuroscience of movement that it was awarded a joint Nobel prize in 2014. The discovery of 'Grid cells' and their distinctive geometric firing patterns by Britt and Edvard Moser built upon the work of their mentor John O'Keefe, the discoverer of 'Place Cells'. Together, these studies gave us our first glimpse at the intricate cellular mechanisms at work in the brain that underlie how we navigate space, and revealed profound connections between location and the formation of memories.
As an installation ‘Perpetual motion’ is a hodological study (the study of pathways) of our past global movements across deep time, and our more intimate passages and navigations through daily life. The project contrasts the vast networks of our ancestor’s migration patterns out of Africa, against our day-to-day meanderings through rooms, buildings and cities.
Out of Africa
Current estimates date the origins of anatomically and genetically modern humans in Africa to between 150,000 and 200,000 years ago, and the first major dispersal of these populations to Asia and Europe is believed to have occurred around 65,000 years before present (B.P.) (4). (Figure 3)
DNA haplogroup maps help trace patriarchal and matriarchal human lineages back across time, in order to understand how populations have spread across the globe. Haplogroup maps rely upon measuring distinctive mutations within genetic elements of the genome that vary little over time.
In males such material is found within the non-recombining portions of DNA in the Y-chromosome. For females similar material is found within Mitochondria, energy providing microscopic structures within human cells that contain their own plasmid-like DNA structures.
Mitochondrial DNA (MtDNA) comprises only a small segment of the total human genome but has proven highly effective in studying early human populations. MtDNA has the advantage of unusually rapid mutation rates, descends almost entirely through the female lineage (via the female ovum / egg), and shows few, if any, of the effects from environmental selective forces.
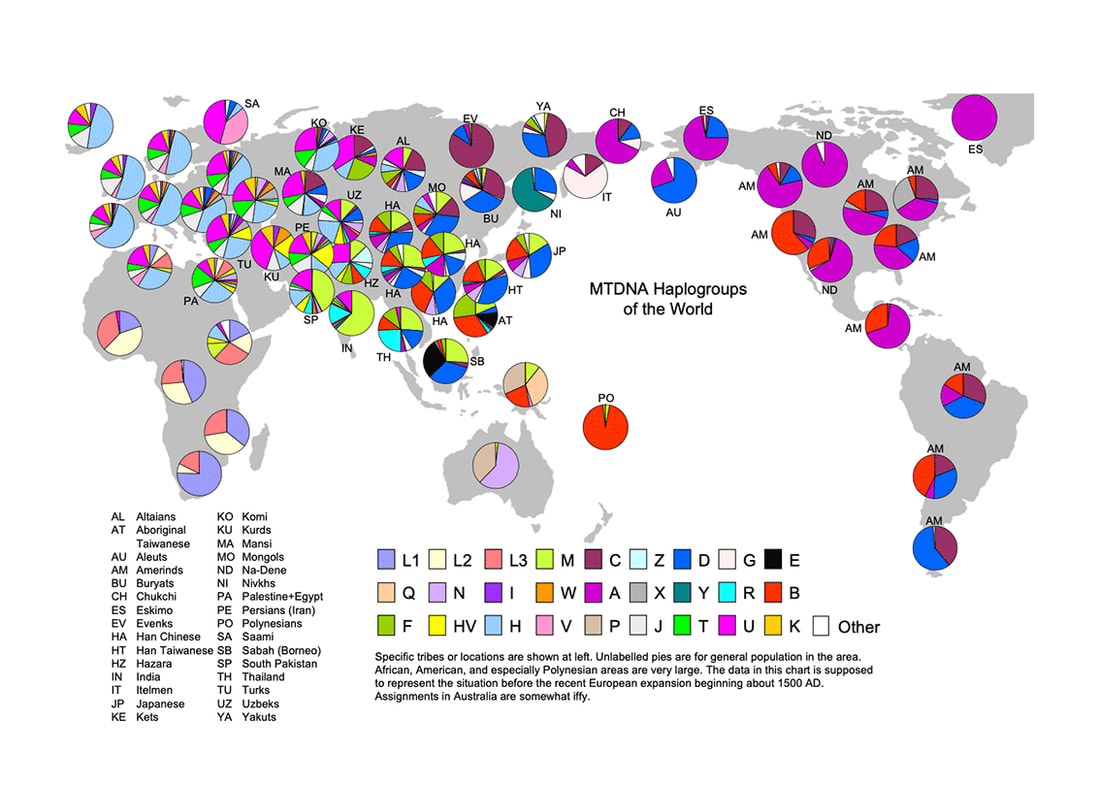
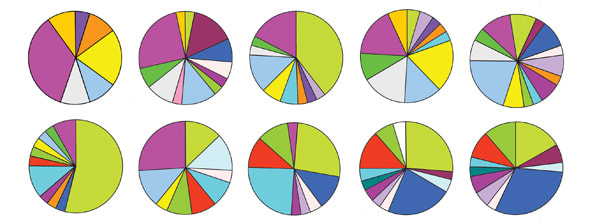
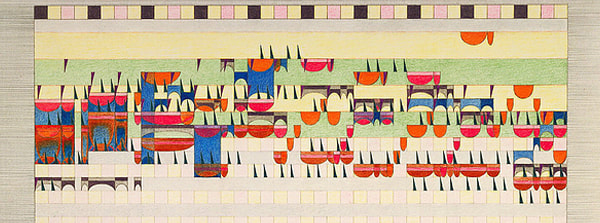
Figure 3: Mitochondrial DNA Haplogroups of the World, circa 1500 AD, Copyright © 2005 J. D. McDonald
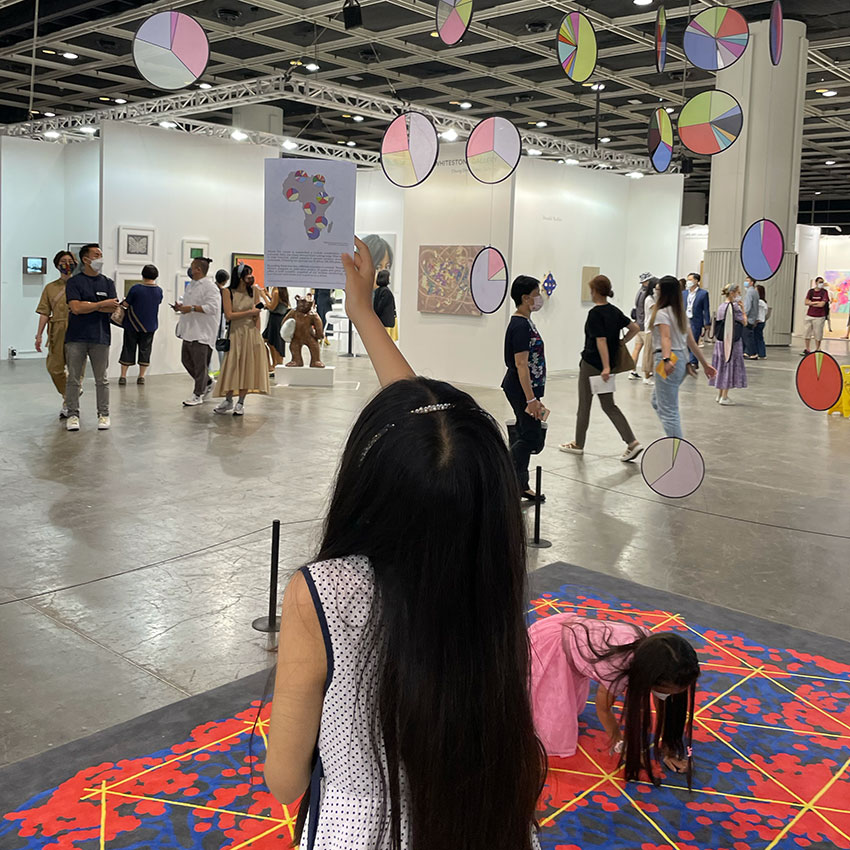
The coloured pie charts in figure 3 represent world-wide genetic variation within female populations. The period of time chosen for the map is circa 1500 AD, just before what's referred to as the 'European expansion', marked by rise of colonial empires and vast commercial networks.
Professor J.D. McDonald, who compiled the chart from a number of location specific studies, noted in his paper that the sampling sizes and thus the accuracy of the chart varies greatly from region to region. In fact, the majority of genetic data is derived from Europe and North America, despite Africa being the most genetically diverse continent on the entire planet (5). I reached out to Prof. McDonald to explain the nature of my project and ask permission to adapt the diagrams from his research into an artwork, which he kindly granted.
For ‘Perpetual Motion’, the 28 colour variations that represent the common MtDNA haplogroups used to compile Prof. McDonald’s map, were meant to be translated in to coloured glass, with each pie chart segment cut using a robotic CNC water-jet machine. The glass segments were then to be reassembled using traditional stained-glass techniques and suspended as a map-like mobile within the exhibition space.
However, with estimated visitor numbers of 20,000 people over the 4 days exhibition, the decision was made to UV-print the disks on acrylic due to health and safety requirements. Each circular diagram was then wrapped in the lead ‘came’ for this version of the sculpture.
The GPS System of the Brain
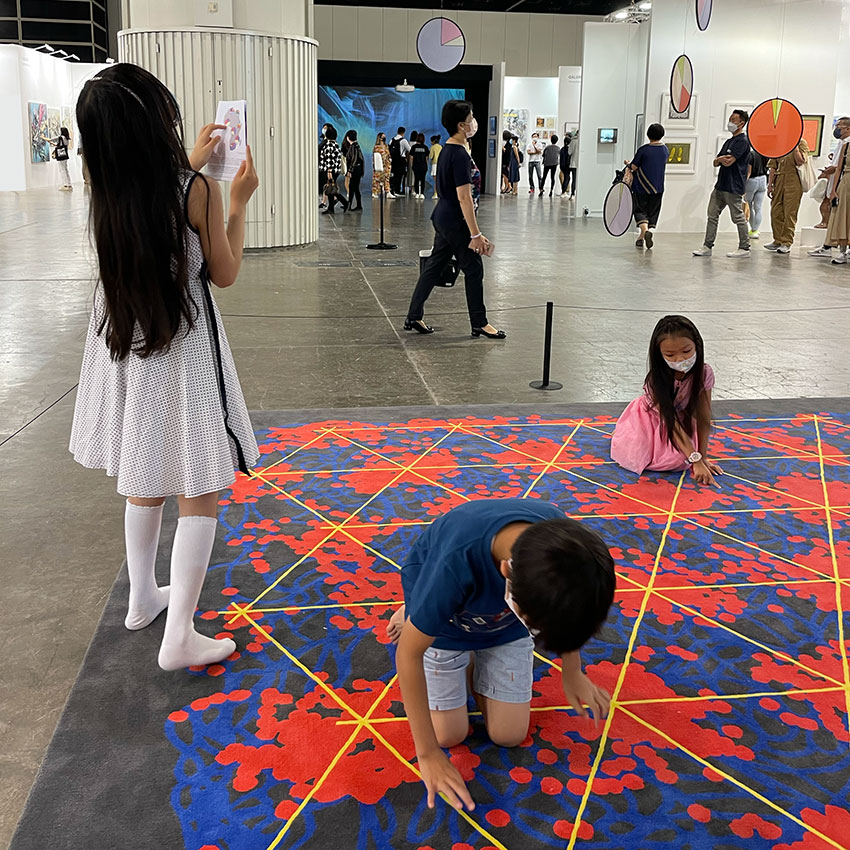
For 'Perpetual Motion', each coloured pie chart was suspended using black monofilaments in its appropriate position, according to the original map, and left spinning beneath a double-ended, hollow, black, branching structure (figures 4a,4b).
Beneath the mobile was positioned another diagrammatic artwork mapping movement and location at very different scales of time and space.
Beneath the mobile was positioned another diagrammatic artwork mapping movement and location at very different scales of time and space.
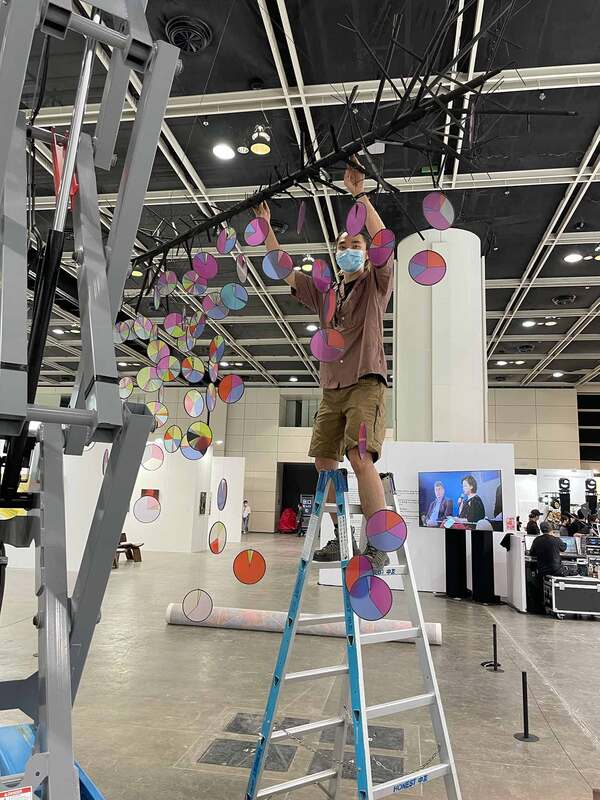 Figure 4a: Perpetual Motion, Installation view | 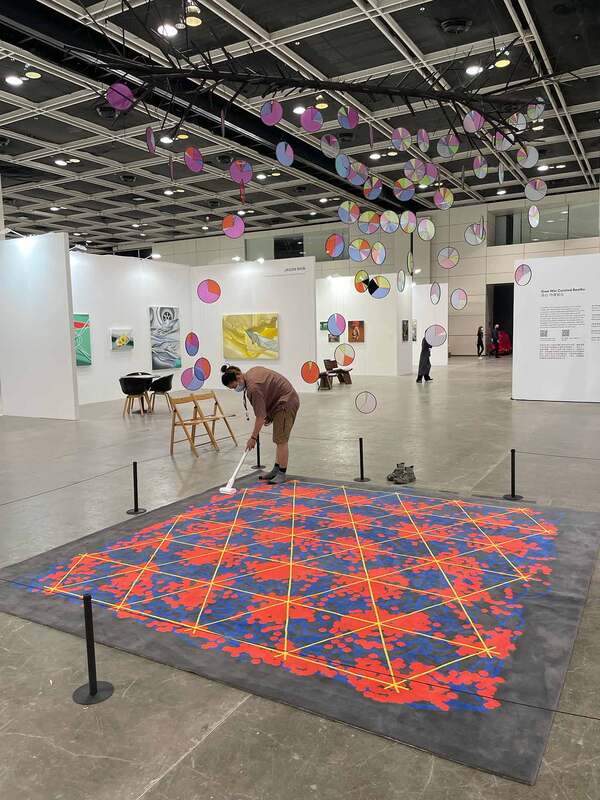 Figure 4b: Perpetual Motion, Installation view |
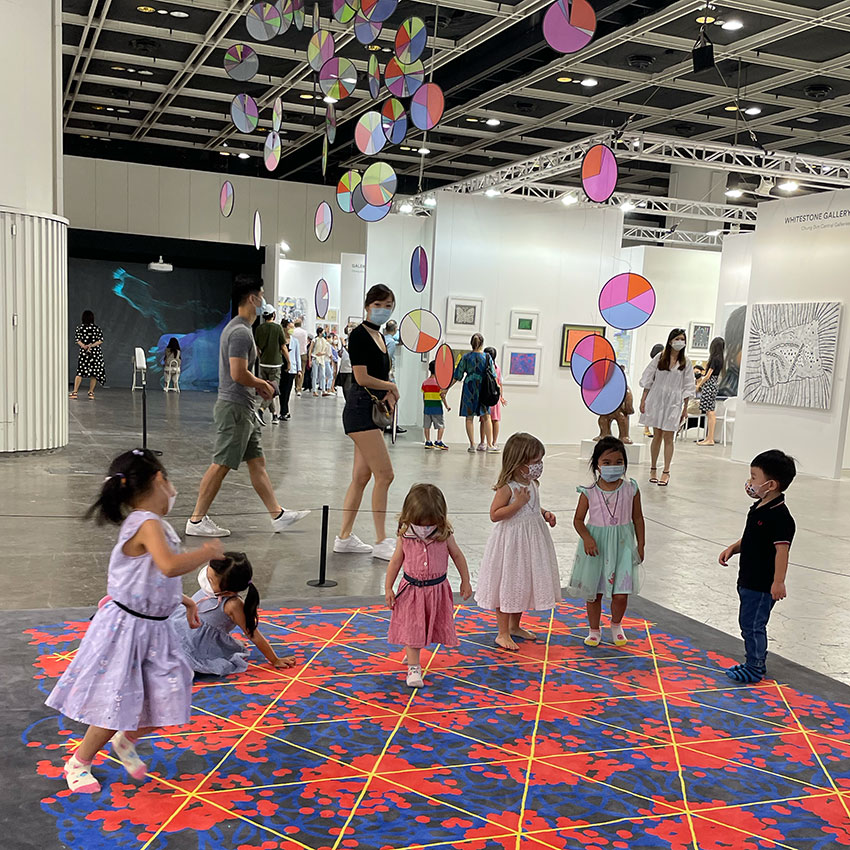
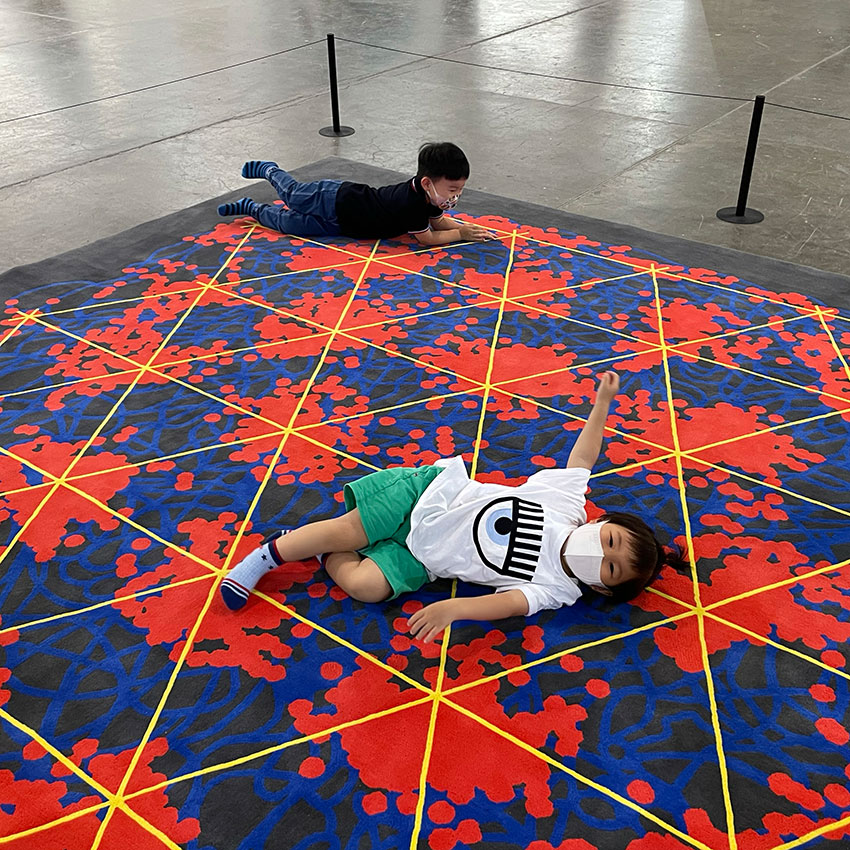
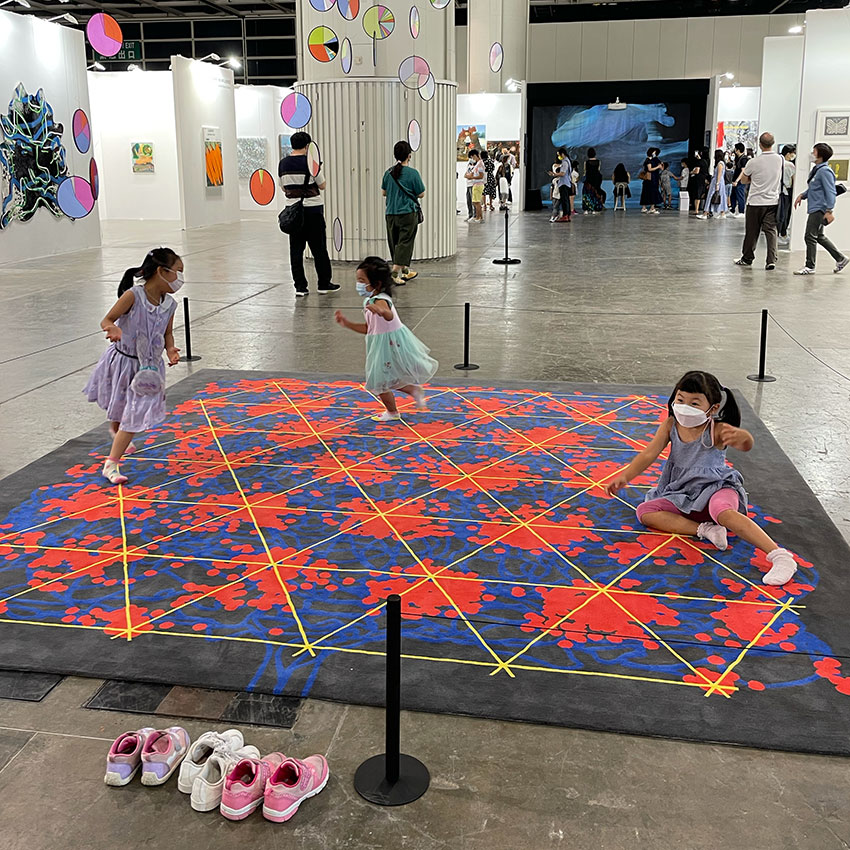
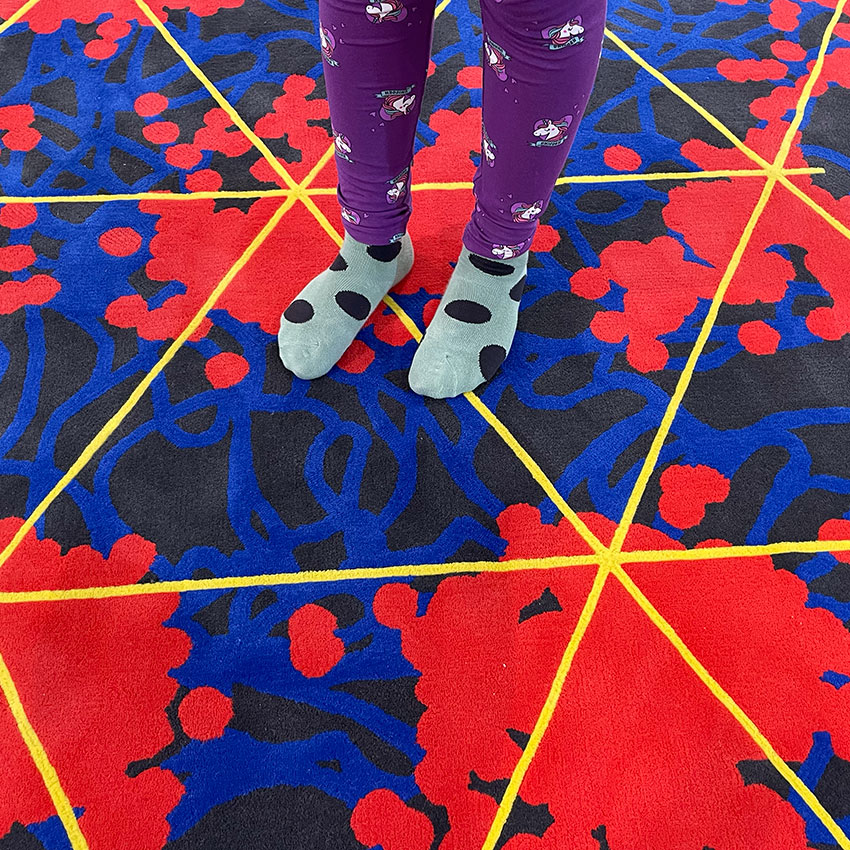
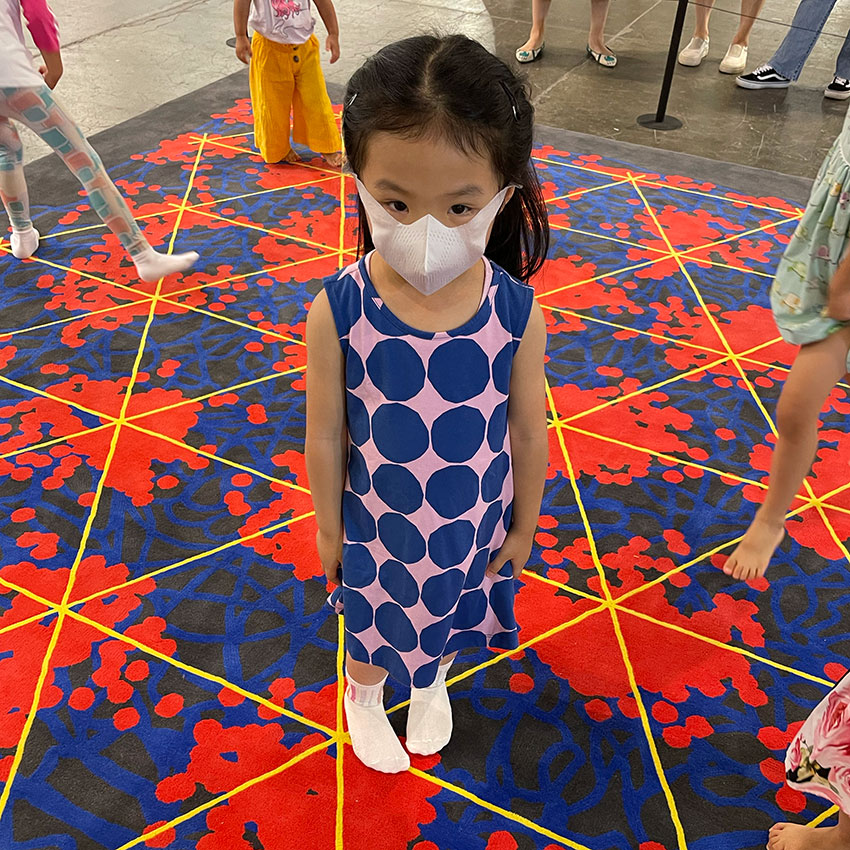
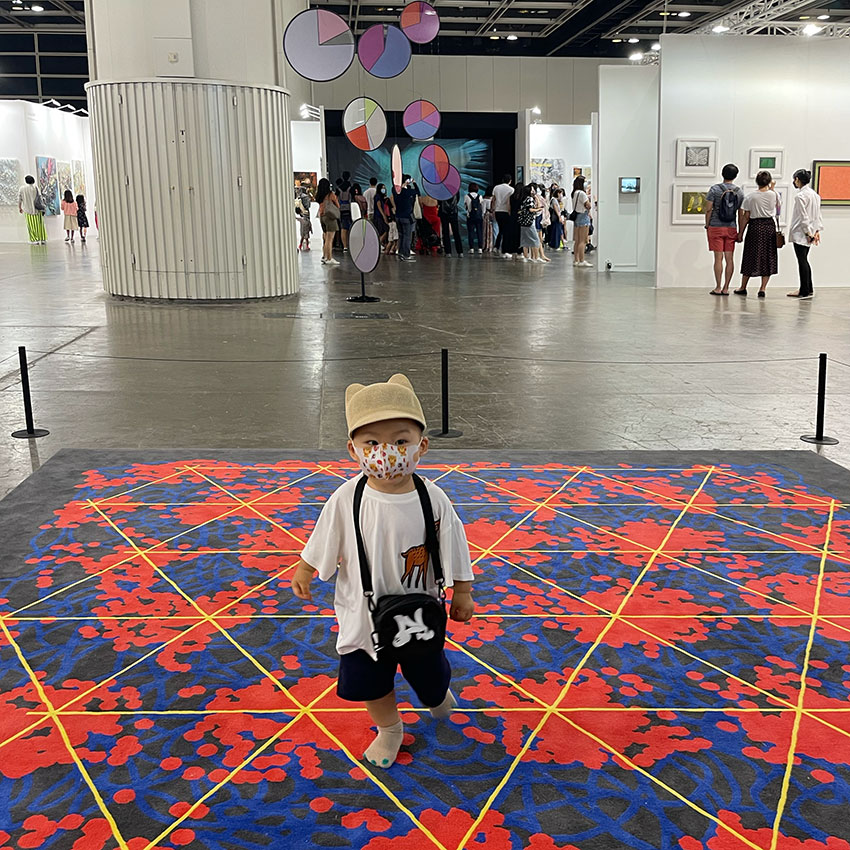
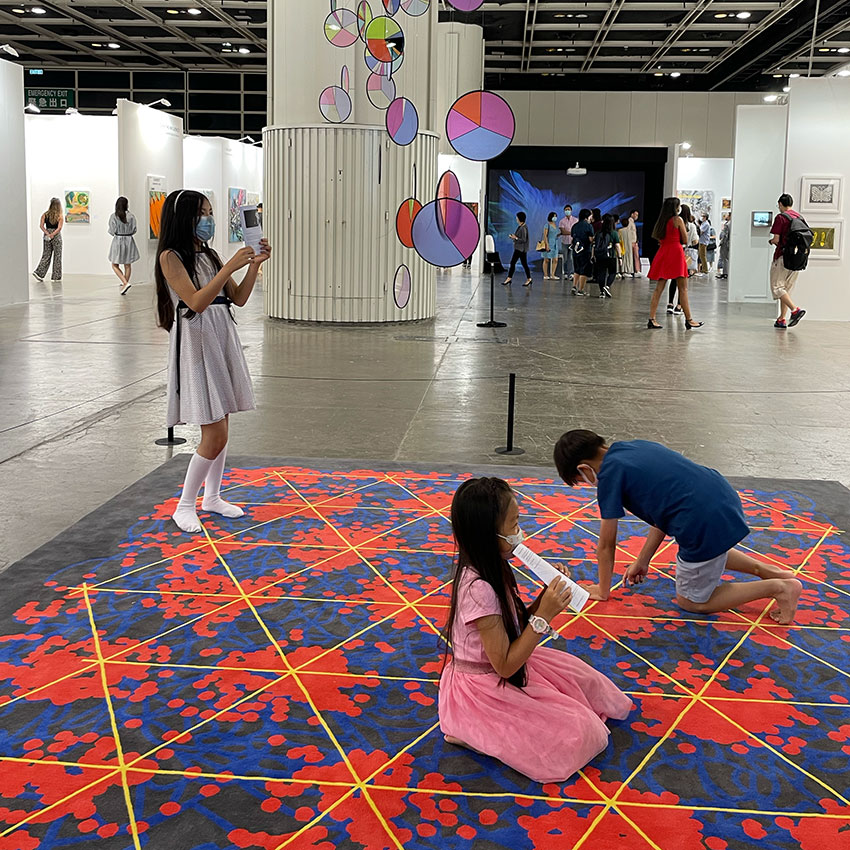
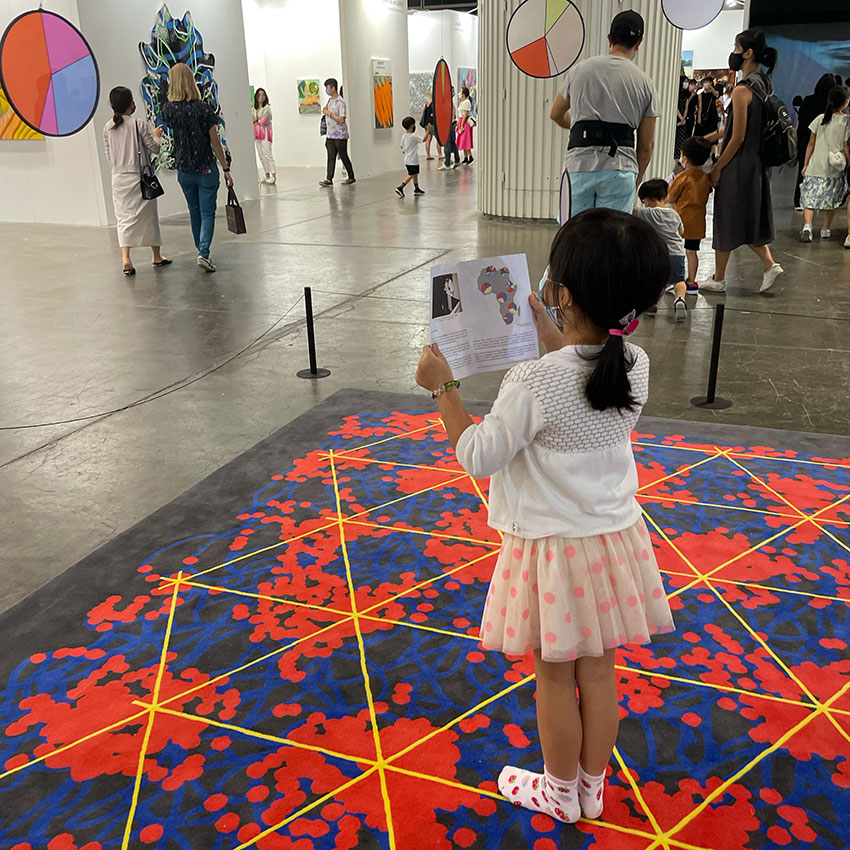
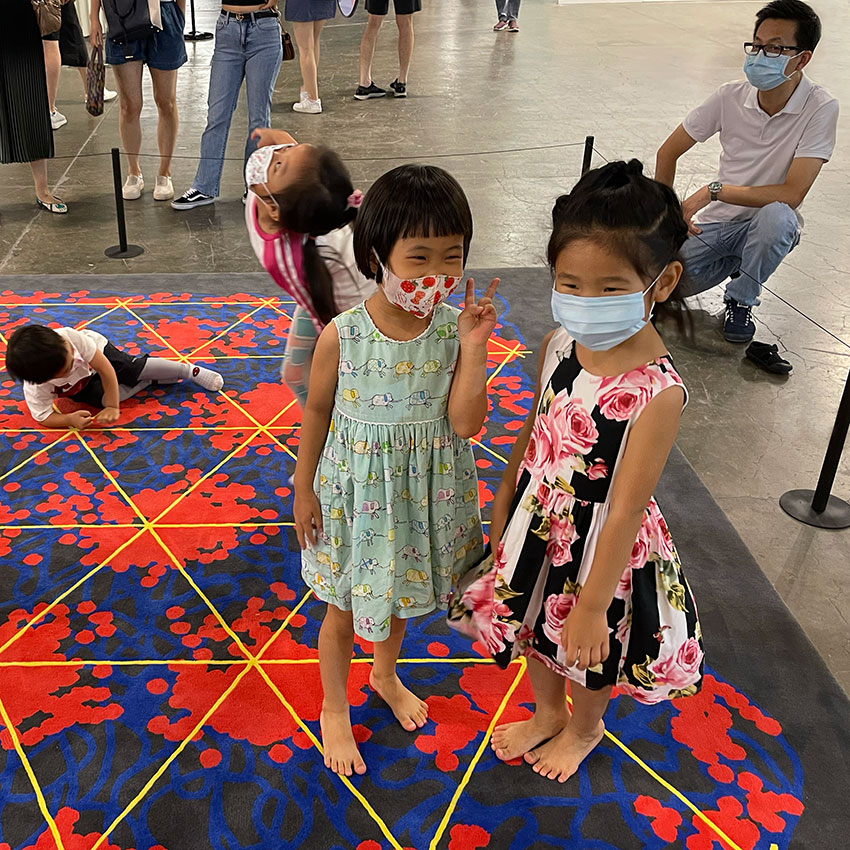
The carpet sculpture is designed to be walked upon, and the pattern is derived from 'Grid cells' in the mammalian brain. The discovery of Grid cells and their distinctive geometric firing patterns by May Britt and Edvard Moser built upon the work of their mentor John O'Keefe, the discoverer of 'Place Cells'. Together, these findings revealed profound connections between the way we navigate space and construct memories of our surroundings.
Grid cells are a specialized type of neuron that constitute a self-positioning system within the brain allowing us to create cognitive spatial maps of the spaces we explore and inhabit. These cells are found within the mammalian entorhinal cortex, a region deep within the brain next to the hippocampus. They derive their name from their triangular grid-like firing patterns, and the phenomenon was first recorded in the brains of mice exploring an experimental test box over a period of time (6) (figure 5).
Figure 5: A video of a single grid cell recorded in the Medial Entorhinal Cortex. A dot is added at the position
of the rat every time the cell spikes. Slowly the dots accumulate and the hexagonal grid-pattern emerges.
of the rat every time the cell spikes. Slowly the dots accumulate and the hexagonal grid-pattern emerges.
At the start of the project I contacted Professors May Britt and Edvard Moser who granted permission for me to adapt images from the research for this installation. Dr. Elmkvist-Nilsen, head of communication at the Kavli Institute for Systems Neuroscience, also kindly sent me copies of the Moser’s research papers, images and presentations. Dr. Elmkvist-Nilsen is a specialist in images of 'knowledge-visuals' generated in scientific research, and has a dual background in visual arts and human/zoo biology.
Interestingly, Nobel Media now owns the rights to the Moser’s original illustrations of grid cells in rodents and humans, and their research group must now produce their own versions before sharing for public use. As a result, I decided to recreate my own diagram of the Moser’s iconic grid-cell firing patterns, which was then used to produce a handmade woolen 3.5 square metre carpet beneath the mobile haplogroup sculpture.
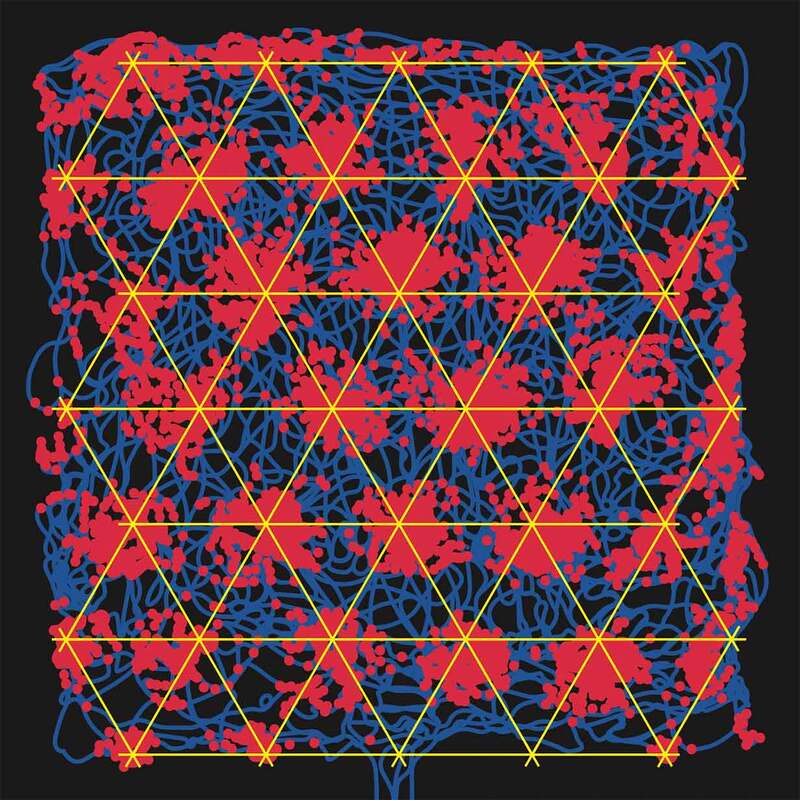
Figure 6: Artist’s recreation of grid-cell firing patters used to create the custom carpet.
Figure 6 shows my recreation of grid-cell firing patters. The blue line represents the path taken by the mouse in search of chocolate drops inside the test chamber, and each red point marks the firing of the single grid cell being measured during the experiment (figure 5,6). The yellow lines highlight the remarkably geometric triangular firing patterns observed within this region of the brain.
As visitors navigated and explored the space, the symbolic markings on the carpet mirrored microscopic neuronal processes occurring within their brains, whilst above them circulated a mobile constellation of pie charts containing genetic data from their historic female ancestors.
I would like to thank Professor J.D. McDonald, Professors May Britt and Edvard Moser and Dr Elmkvist-Nilsen for their enthusiastic support of this project, and for their generous permission to use their research and images to create this installation.

References:
1) Whittle, M. (2020), “Portraits of Thought: Transfiguring the diagrams of science”, Drawing Research Theory Practice, volume 5, number 2. pages 311-317
2) Goodson, H. V. and Hawse, W. F. (2002), ‘Molecular evolution of the actin family’, Journal of Cell 21. Science, 115:13, pp. 2619–22. Online here
3) Hodge, T. and Cope, J. (2000), ‘A myosin family tree’, Journal of Cell Science, 113:19, pages 3353–54.
Online here
4) Why did modern human populations disperse from ca. 60,000 years ago? A new model 10325 9381 - 9386Online: https://doi.org/10.1073/pnas.0510792103
5) Choudhury, A., Aron, S., Botigué, L.R. et al. High-depth African genomes inform human migration and health. Nature 586, 741–748 (2020). https://doi.org/10.1038/s41586-020-2859-7
6) Moser, E., Roudi, Y., Witter, M. et al. (2014). Grid cells and cortical representation. National Review of Neuroscience, 15, pages: 466 - 481 Online: https://doi.org/10.1038/nrn3766
❉ Number 16 in a series of blogs on diagrams in relation to the arts. This was the subject of my PhD at Kyoto City University of the Arts, Japan's oldest art school. Feel free to contact me if you have questions about studying in Japan, the Japanese Monbusho Scholarship (MEXT), what a PhD in Fine Art involves, or diagrammatic art.
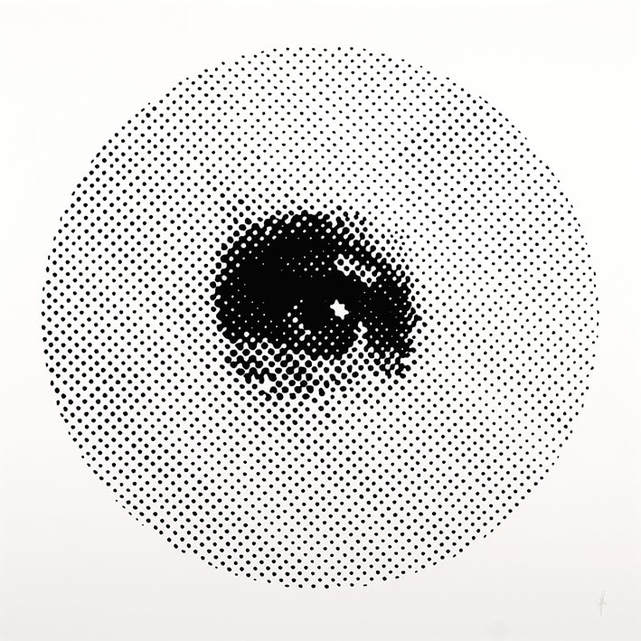
Figure 1: Pupil, Michael Whittle
2013, Ink on paper, 82 x 82 cm
2013, Ink on paper, 82 x 82 cm
Blog post 16 is dedicated to the human visual system, our mind's highest bandwidth connection with external reality. As an artist with a background in biology, vision is a recurrent theme in my drawings and sculptures, which often consider the strengths, weaknesses, origins and limits of the 'wet-ware' that underlies visuality, and facilitates the way we create and experience visual art. Our scientific understanding of the intricacies of vision is constantly evolving over time, and this is something I try to take in to account in the vision-related works I make as an artist.
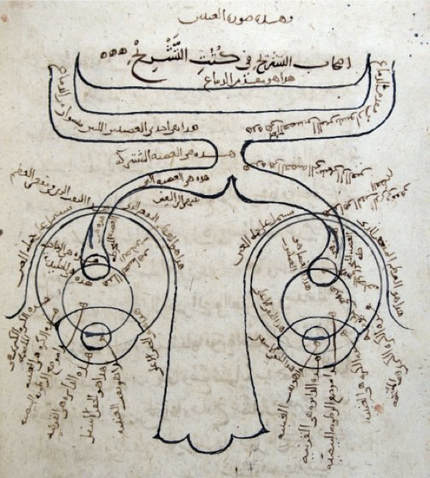 Figure 2: Ibn al-Haytham: Diagram of the human visual system. From a 1083 copy of his Kitāb al-Manāzir, Süleymaniye Library, Istanbul. | It's now over a thousand years since the Golden Age of Arabic Science, during which time Ibn al-Haytham published his magisterial 7 volume treatise on optics the ' Kitab al-Manazir ' (1015), from which the diagram in figure 2 is taken (1). Translated into Latin in the 13th century as ' De Aspectibus ', and again in 1572 after the advent of the printing press, the ideas it contained would influence generations of European thinkers throughout the middle ages and on in to the Renaissance. Al-Haytham's methodical attention to detail and insistence on evidence based reasoning meant that he's often referred to as not only the father of modern optics, but one of the World's first true proponents and practitioners of the scientific method. |
Figure 2 is particularly interesting because of artistic restrictions on Muslims against depicting living or sentient beings, known as Aniconism. However Al-Haytham's use of the abstractive powers of the diagram meant that he was able to draw an elegantly stylised nose, the eyes and their lenses, and the optic nerves to the visual cortex at the back of the brain (shown here at the top of figure 1). Remarkably, he even included the chiasma or 'crossing point' of the optic nerves within the brain.
Al-Haytham's work on optics proposed a systematic solution to the problem of vision that combined experimental investigations in to the behavior of light with inventive geometrical proofs and constant forays into the psychology of visual perception. His insight that light is composed of particles for example, would later be described by Newton and finally proven by Einstein in his work on the 'photoelectric effect' in 1905, for which he later won the 1921 Nobel prize for physics.
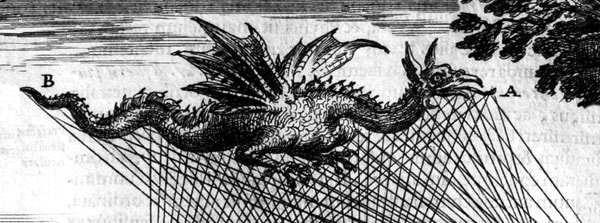
The treatise offered a coherent alternative to the Euclidean and Ptolemaic theories of visual emission, in which visual rays were believed to be emitted from the eye, curiously emphasized by the peculiar hands gestures in figure 3 below. This esoteric idea was first proposed by the 5th century Greek philosopher Empedocles, who claimed that vision was enabled by the goddess Aphrodite, who lit a divine fire within the human eye.
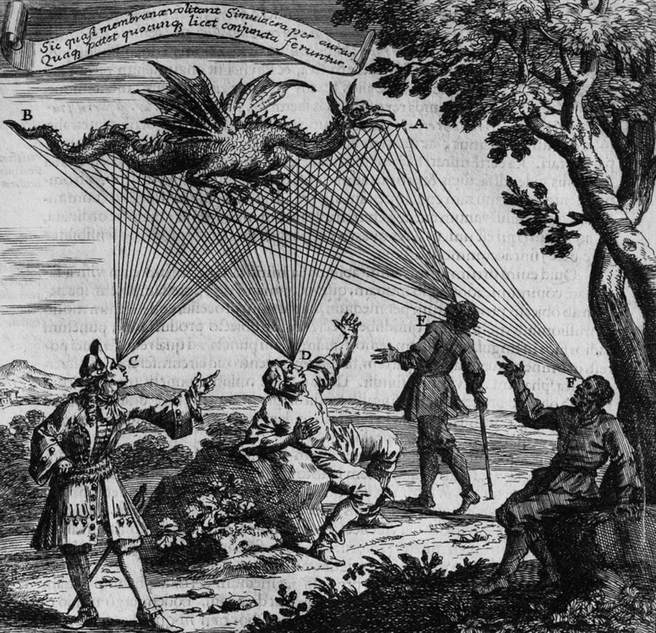
Figure 3: Johann Zahn - Emission Theory, “Oculus Artificialis Teledioptricus Sive Telescopium”, 1685.
One important aspect of vision that Al-Haytham did get wrong was the fact that an image projected by a lens is upside down and flipped right-to-left. Even though this is clearly contained within his optical formalism, it was apparently more than he could accept in a theory of vision. However, Leonardo da Vinci (b.1452) also failed to accept this when he approached the problem almost 500 years later.
Johannes Kepler (b.1571) directly followed al-Haytham's formalism to its inevitable and logical conclusion in his mechanistic theory of the retinal image that was to replace its impressionistic predecessor. However even he struggled to accept what al-Haytham called the "monstrous" distortion of sensation that would be provoked by inversion of the image, and it remained for René Descartes (b.1596) to compile his own theory of vision, beautifully illustrated with diagrams and far closer to our current understanding (figure 4).
Johannes Kepler (b.1571) directly followed al-Haytham's formalism to its inevitable and logical conclusion in his mechanistic theory of the retinal image that was to replace its impressionistic predecessor. However even he struggled to accept what al-Haytham called the "monstrous" distortion of sensation that would be provoked by inversion of the image, and it remained for René Descartes (b.1596) to compile his own theory of vision, beautifully illustrated with diagrams and far closer to our current understanding (figure 4).
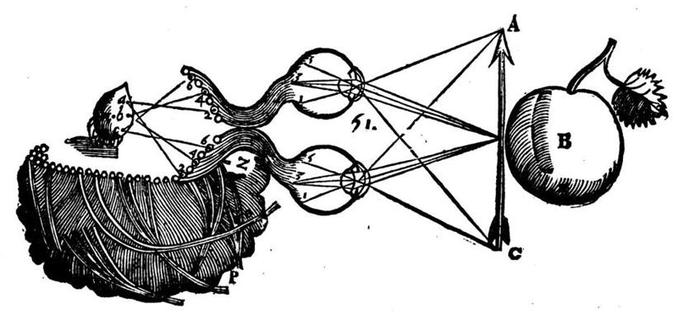
Figure 4: The Descartes diagram from 1664 shows how physical impulses, transmitted in the form of rays from the arrow into the eye give rise to physical impulses through the optic nerves and then into the brain to the pineal gland, which he incorrectly believed served as the nexus between the mind and body.
When contemporary scientists talk about vision there’s no mention of pictures traveling intact from the eye to the brain. Instead they describe systems of synapses, their electrochemical responses and complex notions of encoded information transfer that somewhat support the theory of Kepler, but most definitely that of Descartes.
Figure 4 above depicts Descartes theory of how physical impulses are transmitted in the form of rays from the arrow into the eye give rise to physical impulses through the optic nerves and then into the brain to the pineal gland, which he incorrectly believed served as the nexus between the immaterial mind (which he referred to as res-cogitans) and the physical body (res-entensa).
Figure 4 above depicts Descartes theory of how physical impulses are transmitted in the form of rays from the arrow into the eye give rise to physical impulses through the optic nerves and then into the brain to the pineal gland, which he incorrectly believed served as the nexus between the immaterial mind (which he referred to as res-cogitans) and the physical body (res-entensa).
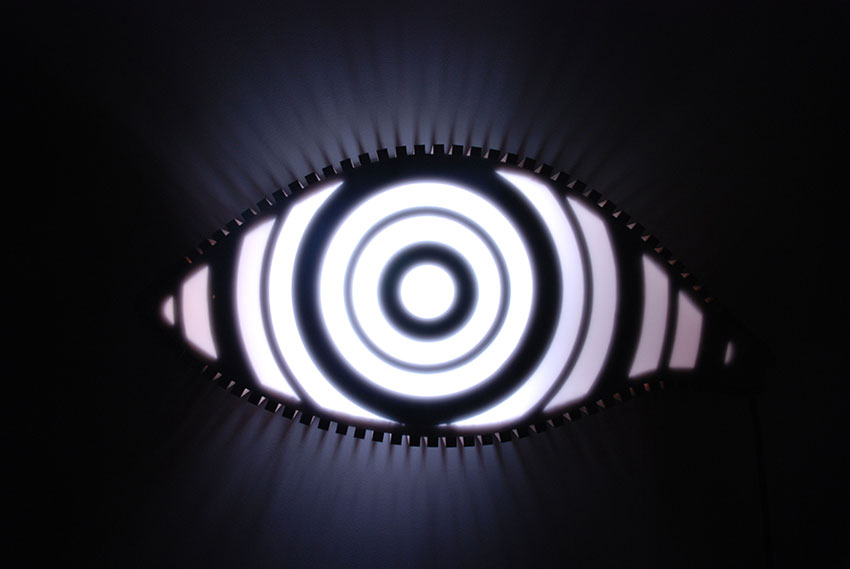
Figure 5: Target, Michael Whittle
2013, Wood, perspex, Japanese archery target, strobe-lights, 42 x 89 x 19 cm
2013, Wood, perspex, Japanese archery target, strobe-lights, 42 x 89 x 19 cm
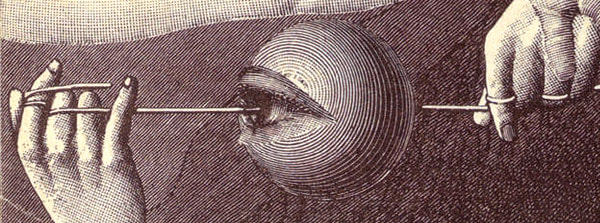
Descartes seems to have been the first person to have clearly expressed the correct solution to the 'monstrous' problems of the visual system, and he starts by pointing out why the problem arises, namely because it is so tempting to think that the act of 'seeing' amounts to having, somewhere in the brain, a little picture that can be looked at by the mind. Descartes dismisses this notion by pointing out that the code which instantiates sensations in the brain need have no resemblance to the sensation itself (2).
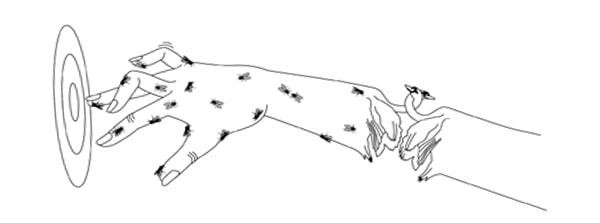
 Figure 6: Descartes' blind man probing the environment with sticks. No confusion arises concerning the location of objects despite the fact that the sticks are crossed. | He goes on to point out that so long as there are systematic rules that link eye or body motions to changes in the retinal image, the brain will be able to construct a correct representation of space. Cleverly, descartes uses the analogy of a blind man who is exploring his environment with the aid of a stick AD, held in his right hand and a stick, CB, held in his left hand (figure 6). Even though the blind man may cross the sticks in front of him, just as the image is inverted on the retina, no confusion concerning the location of objects will result from this (3). |
Until only recently the idea of fully understanding the inner workings of the eye was considered a problem of such intractable complexity that it was often held as evidence of a supernatural engineer. Even Darwin himself appeared troubled at first, remarking in an often misquoted aside in Origin of the Species that the whole idea that something so flawless “could have been formed by natural selection, seems, I freely confess, absurd in the highest degree.”
However as with all complex biological features, the human visual system arose unimaginably slowly over hundreds of millions of years of clumsy trial and error, and on closer inspection we find numerous examples of evolutionary concession and compromise. As a result, the human eye and visual system is just good as it needs to be and no better, and systemic errors have to be accommodated for using sophisticated cognitive processing techniques (the blind spot is a good example of this).
For an excellent article covering this topic click here: The Poor Design of the Human Eye.
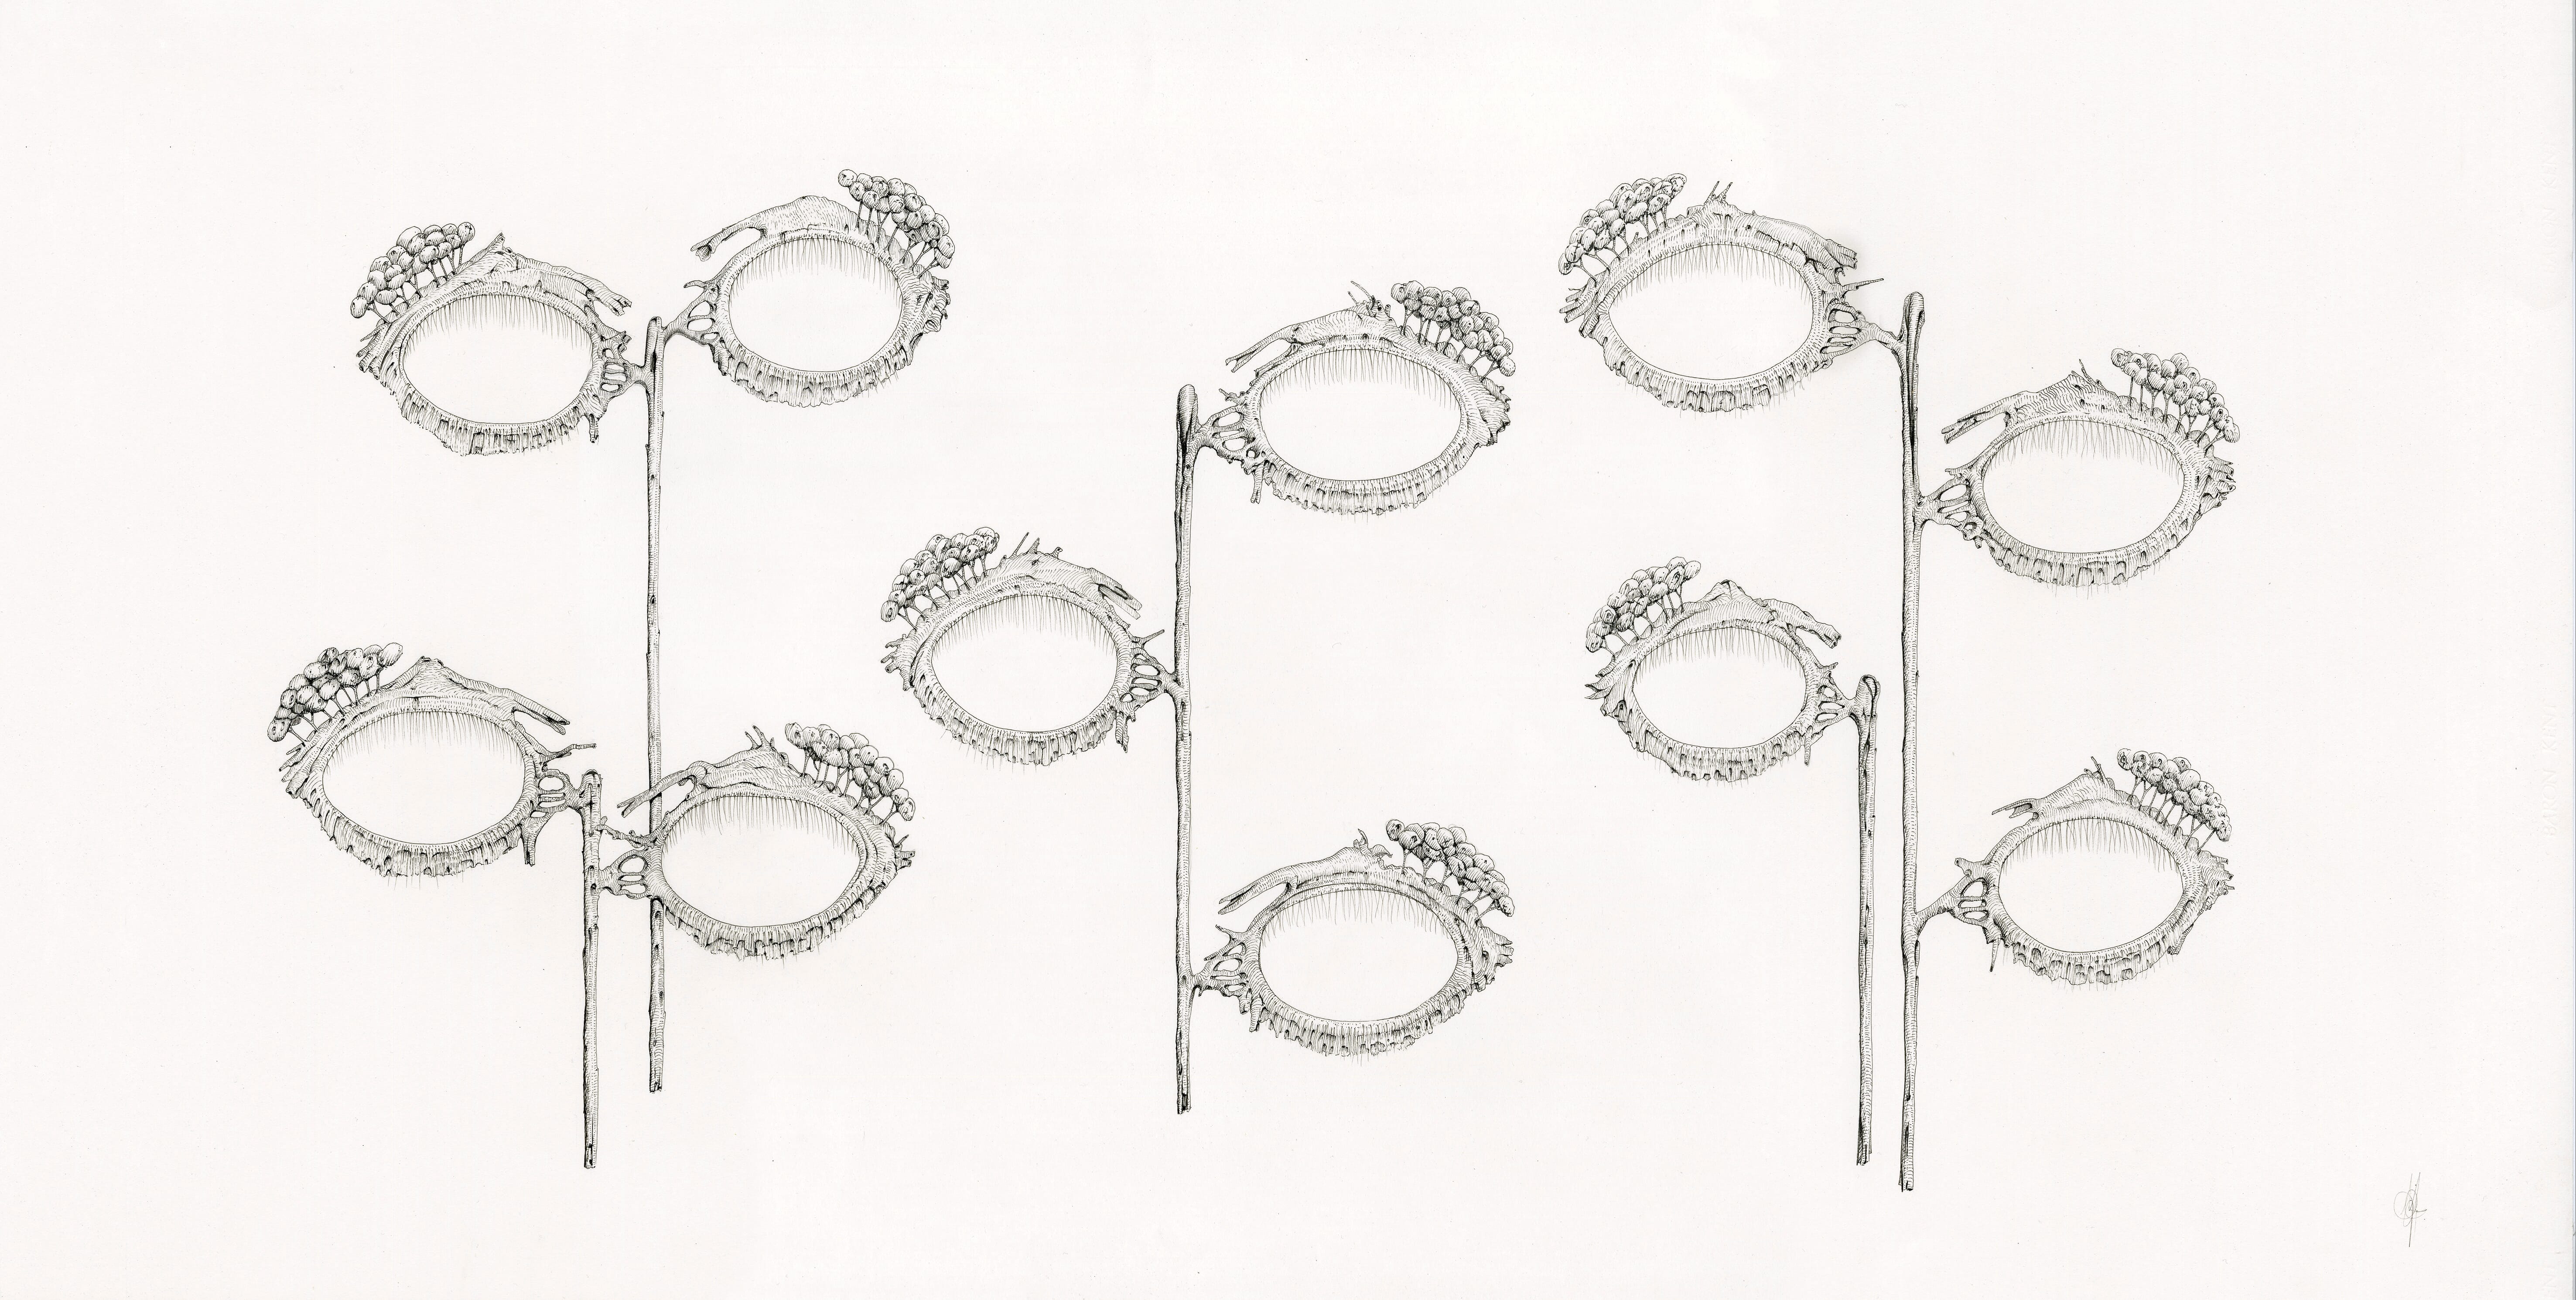
Figure 7: Tear glands, tear ducts, Michael Whittle
2013, ink on paper, 45 x 84 cm
2013, ink on paper, 45 x 84 cm
Design limitations aside, humans are primarily visual creatures, as attested to by the fact that almost half of the brain is either directly or indirectly involved in processing visual information. The primary visual cortex cooperates with numerous other parts of the brain to process different components of the vast amounts of visual information collected by the eyes. Al-Haytham's 1000 year old diagram actually captured the surprising fact that the retinas of the eyes are literally outgrowths of the brain itself.
The last decade of brain research has revealed more about the human brain than all the years of prior research combined. The number of neurons devoted entirely to visual processing is now estimated to be in their hundreds of millions, taking up about 30% of the whole cortex, as compared with 8% for touch and only 3% for hearing. Each of the two optic nerves that carry signals from the retina to the brain consists of a million fibers, whereas each auditory nerve carries a mere 30,000.
The last decade of brain research has revealed more about the human brain than all the years of prior research combined. The number of neurons devoted entirely to visual processing is now estimated to be in their hundreds of millions, taking up about 30% of the whole cortex, as compared with 8% for touch and only 3% for hearing. Each of the two optic nerves that carry signals from the retina to the brain consists of a million fibers, whereas each auditory nerve carries a mere 30,000.
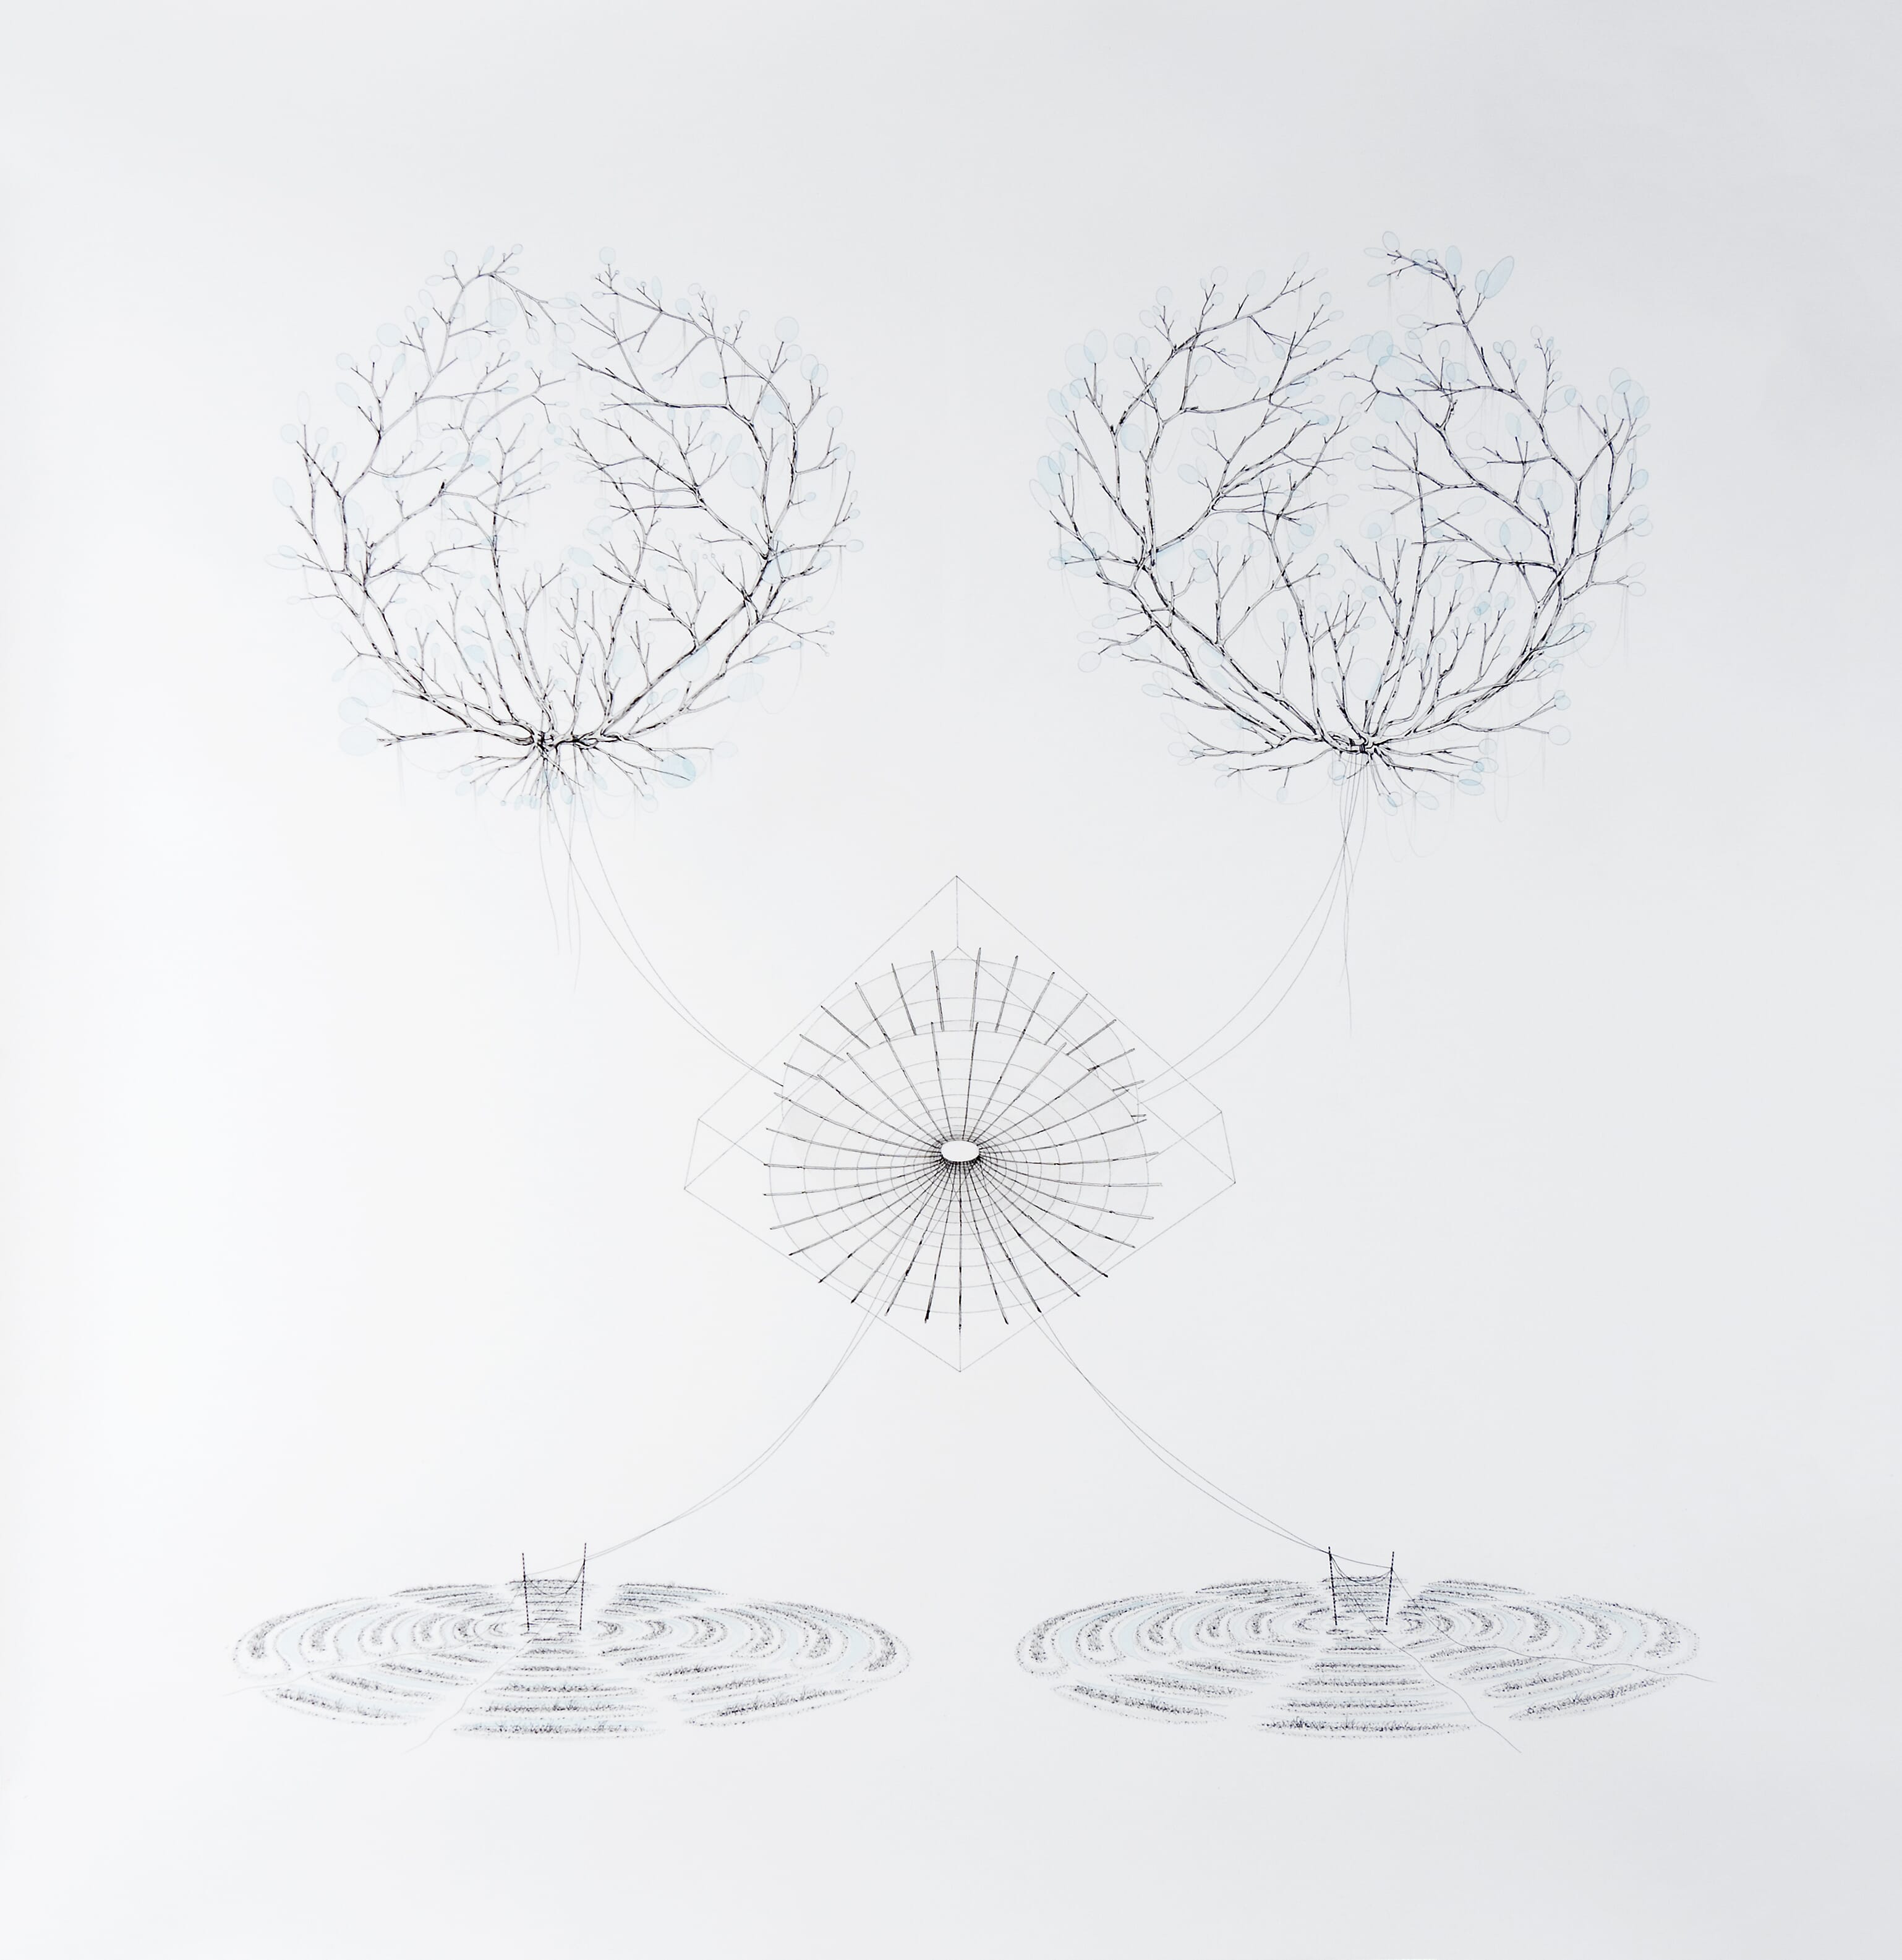
Figure 8: Optic tract, Michael Whittle,
(Neural network detected retinal vasculatures with catenoid and
two point source interference patterns), 2017, 97 x 92 cm, Ink, pencil, and watercolour on paper
(Neural network detected retinal vasculatures with catenoid and
two point source interference patterns), 2017, 97 x 92 cm, Ink, pencil, and watercolour on paper
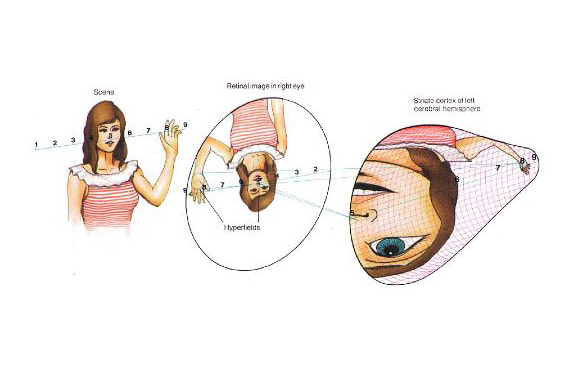
Figure 9 below is a simplified anatomical diagram showing the various routes the optic nerves, and how data from the various quadrants of the visual field gets divided up en-route to the visual cortex at the back of the brain.
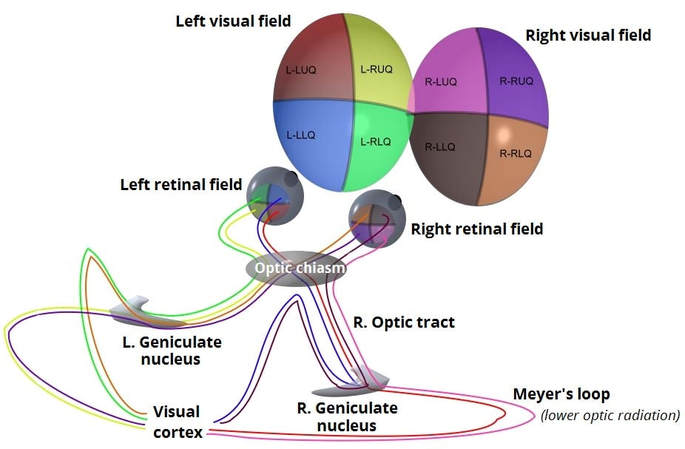
Figure 9: Anatomy of the Human Optic Tract
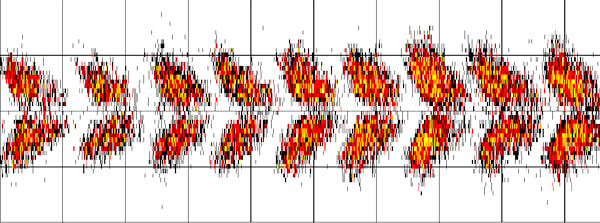
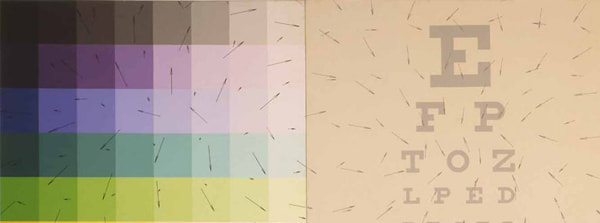
Figure 10 below shows the results of an important 1988 experiment to physically demonstrate the relationship between visual images and their perception in visual cortex. A Macaque monkey was shown a striped visual target and given a dose of glucose with a radioactive marker attached. Glucose molecules are most rapidly absorbed by the most active cells, and in this case the scientists were most interested in the cells of the visual cortex.
When the visual cortex of the Macaque was removed and simply pressed on to a radio-sensitive plate, enough to the radioactive marker had became most concentrated in the most active cells to leave a trace on the plate. The external, striped target on the left was shown to map directly on to the internal, organic material of the brain on the right. Point F represents data captured by a small area of incredibly highly sensitive retina known as the Fovea, where detail is at its highest.
When the visual cortex of the Macaque was removed and simply pressed on to a radio-sensitive plate, enough to the radioactive marker had became most concentrated in the most active cells to leave a trace on the plate. The external, striped target on the left was shown to map directly on to the internal, organic material of the brain on the right. Point F represents data captured by a small area of incredibly highly sensitive retina known as the Fovea, where detail is at its highest.
Figure 10: A flickering stimulus (left) and its 'retinotopic representation' in layer 4C of V1 in the visual cortex of a Macaque monkey (right), revealed through CO staining. Reproduced from Tootell et al (1988a).
It's probably worth repeating - what you're looking in figure 10 is an actual metabolic imprint of the external environment being mapped on to the structure of the brain at the cellular level, half to the left and half to the right. More details of how this image was created are included in the footnotes below as note 4 (4).
Original paper: Tootell RB, Switkes E, Silverman MS, Hamilton SL (1988) Functional anatomy of macaque striate cortex. II. Retinotopic organization. J Neurosci 8:1531–1568. Abstract/FREE Full Text: Google Scholar
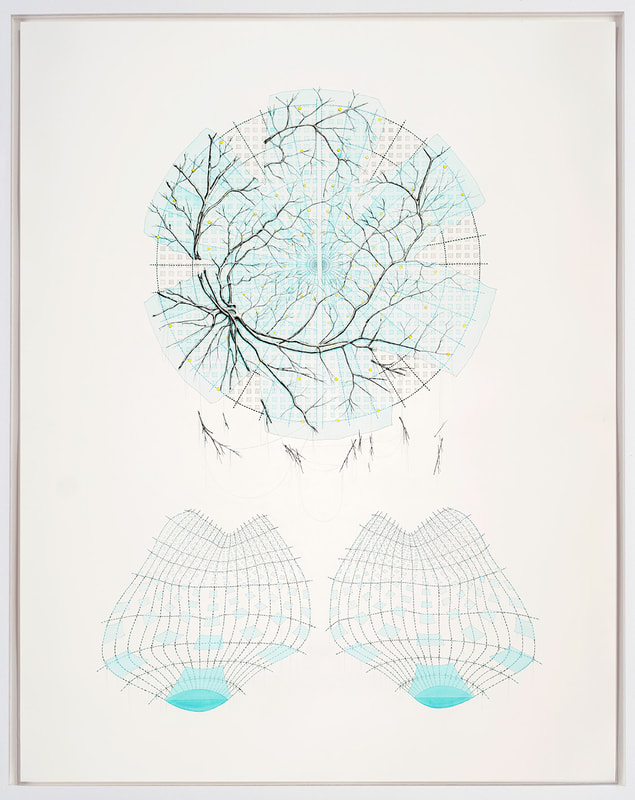
Figure 11: Michael Whittle, Model for the reorganization of visual information
(Retinotopic visual stimuli map of primate striate visual cortex with retinal vessel shadows),
2017, 140 x 108 cm, Ink and watercolour on paper,
(Retinotopic visual stimuli map of primate striate visual cortex with retinal vessel shadows),
2017, 140 x 108 cm, Ink and watercolour on paper,
Figures 12a and b present hypothetical examples of how complex, real world images are believed to be processed and mapped out within the structures of the brain as 'Retinotopic Representations' in the 2 lobes of the visual cortex at the back of the brain.
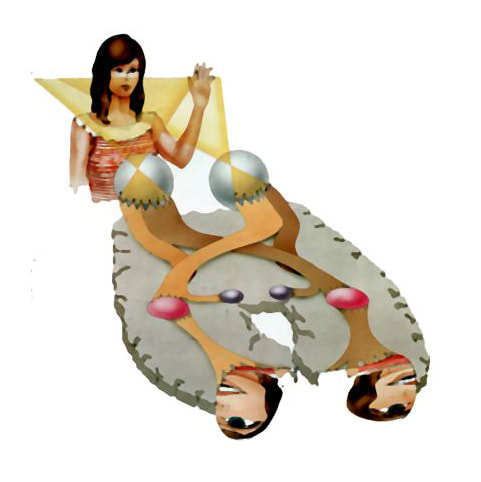 |  |
Figures 12a, b: Diagrammatic representations of decoded visual images as
divided, inverted and distorted with in the visual cortex, from Frisby & Stone (2010), p. 6.
divided, inverted and distorted with in the visual cortex, from Frisby & Stone (2010), p. 6.
Visual data from the tiny foveal region is given maximum priority over that collected from the rest of the retina, with approximately half of the nerve fibers in the optic nerves carrying information from the fovea alone, while the remaining half carrying information from the rest of the retina.
It's an interesting realisation that this tiny high resolution part of your vision is about the same size as your thumb nail held at arms length in front of your eye. Rather than the eye acting as a camera that takes in a complete image, the act of looking is in fact a process of diagramming the world using that tiny region of high resolution information provided by the fovea.
One of the pioneering researchers of how the human visual system relies on such diagrammatic eye movements was the Russian psychologist Alfred Yarbus (1914-1986). Yarbus conducted several influential experiments using suction caps attached to the eyes to track eye movements while participants viewed various images and scenes. His most famous study, published in the book "Eye Movements and Vision" (1967), demonstrated that the way people move their eyes while looking at a picture depends on the task they are given or the information they are seeking.
Figure 13 shows the results of one such experiment, and the rapid series of twitching eye movements, known as saccades, that scan the world around us as we process our surroundings. Nicholas Wade from the University of Dundee (UK) & Galina Rozhkova from the Institute for Information Transmission Problems at the Russian Academy of Sciences (Moscow) have compiled an excellent website detailing the work of Yarbus, and how his discoveries laid the foundations for the study of human vision and cognition: https://yarbus.eu/faces/.
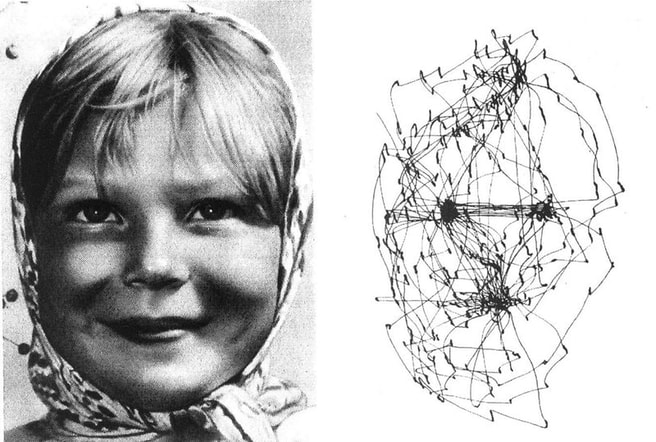
Figure 13: Girl from Volga, Alfred Yarbus
Record of the eye movements during free examination of the photograph with both eyes for 3 minutes
Record of the eye movements during free examination of the photograph with both eyes for 3 minutes
Al-Haytham was rightly concerned about the monstrous distortions involved in human vision and visual processing. During their decoding, images are not only inverted but divided and distorted with in the visual cortex, and yet our visual experience of the external world remains immersive and wholly convincing.
Finally, to end the post is a clip from an interview with the Nobel prize winning physicist Richard Feynman, who spent many of years of his distinguished career investigating the fundamental nature of light at the level of photon-photon interactions. During the clip he discusses the phenomenon of vision and the tiny segment of the electromagnetic spectrum that it evolved to detect.
Notes:
1) al-Haythem wrote the series on optics whilst working at Cairo's al-Azhar Mosque sometime between 1028 and 1038
2) "Apart from that, it is necessary to beware of assuming that in order to sense, the mind needs to perceive certain images transmitted by the objects to the brain, as our philosophers commonly suppose; or at least, the nature of these images must be conceived quite otherwise than as they do: For, inasmuch as [the philosophers] do not consider anything about these images except that they must resemble the objects they represent, it is impossible for them to show us how they can be formed by these objects, received by the external sense organs, and transmitted by the nerves to the brain. And they have had no other reason for positing them except that, observing that a picture can easily stimulate our minds to conceive the object painted there, it seemed to them that in the same way, the mind should be stimulated by little pictures which form in our head to conceive of those objects that touch our senses; instead we should consider that there are many other things besides pictures which can stimulate our thought, such as, for example, signs and words, which do not in any way resemble the things which they signify." Descartes, Optics, Fourth discourse (p. 89 in trans. by P.J. Olscamp)
3) "So that you must not be surprised that the objects can be seen in their true positions, even though the picture they imprint upon the eye is inverted: for this is just like our blind man's being able to sense the object B, which is to his right, by means of his left hand, and the object D, which is to his left, by means of his right hand at one and the same time. And just as this blind man does not judge that a body is double, although he touches it with his two hands, so likewise when both our eyes are disposed in the manner which is required in order to carry our attention toward one and the same location, they need only cause us to see a single object there, even though a picture of it is formed in each of our eyes." Descartes, Optics, Sixth Discourse, trans. P.J. Olscamp, p. 105.
4) Figure 10 shows the results of an experiment in which an anaesthetized Macaque monkey viewed a flickering bulls-eye pattern, and was then injected with radioactively labeled glucose (a special type of glucose with a radioactive Fluorine molecule attached). The glucose was taken up in higher amounts by the most active neurons. Area V1 of the visual cortex was then surgically removed and flattened before being used to expose radioactively sensitive film. The result is a picture of regions of activity evoked by the bulls-eye pattern, creating what is known as a 'Retinotopic Map'.
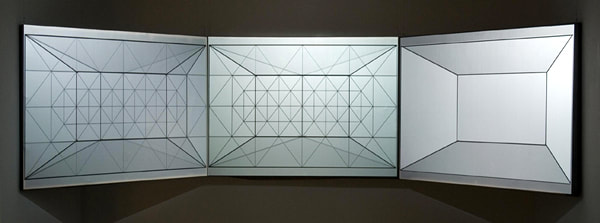
❉ Blog post 11 on diagrams in the arts and sciences examines a three-part drawing I made in 2007 titled 'Clouds, Glands, Tributaries'. This minimal, diagrammatic, meditation on water turned out to be a turning point in my artistic practice, bringing together my interest in encyclopaedias, diagrams, the sciences and romanticism for the first time.
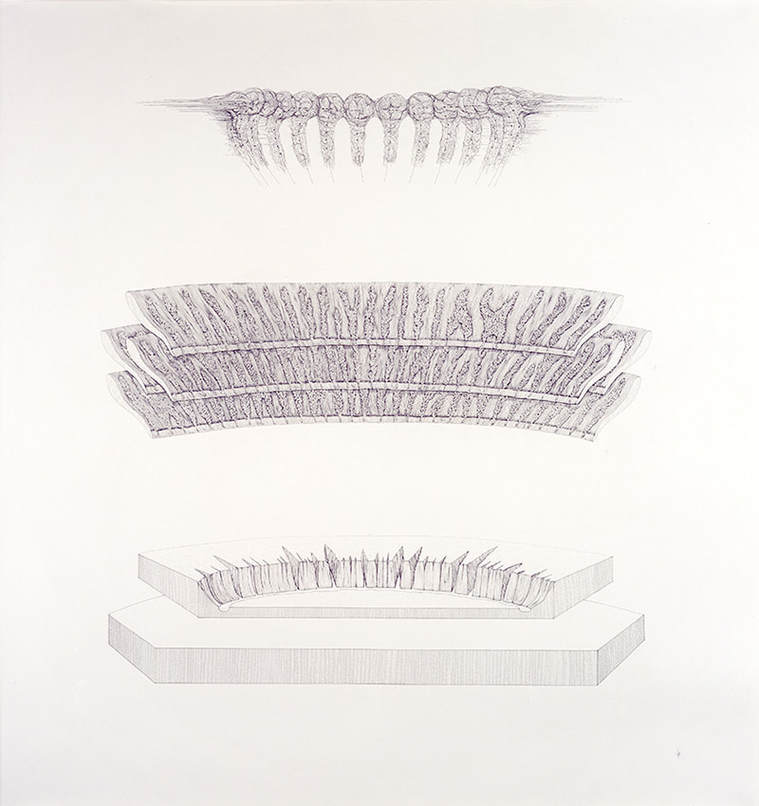
Image 1: Michael Whittle, Clouds, glands, tributaries, 2007, Ink on Paper, 133 x 125.5 cm
'Clouds, glands, tributaries' was drawn as part of a series of new works for the exhibition 'The Louder the Sun Blooms' held in New York, 2007. The title for the show was taken from the Dylan thomas Poem 'Poem on his Birthday', as the synesthetic image conjured by the words associate sound, heat, light and the unfurling of life with romantic notions of temporary beauty.
The limitations of the human senses and of human thought are interests that connect not only the works in that particular exhibition, but the majority art that I've produced over the last 10 years. Other common themes include our attempts to classify and comprehend the world around us, taking into account our biological limitations, and, most importantly, the dissonance that arises from our division of existence in to the subjective inner world of experience and an objective outer world of physical reality.
As an undergraduate student of Biochemistry, I was summoned by the head of the department to his office after our end of year examinations, where he cautioned me against my use of adjectives such as 'subtle', 'intricate' and 'profound' in an essay on molecular biology. Science, I was told, was like a game of cricket, which relies upon everyone playing by the same rules. Subjectivity, it turns out, was to be avoided at all costs in the context of a Biochemistry examination.
Five years later at the Royal College of Art, the vice chancellor, himself a former Biochemist, described my entry for the 2003, RCA Christmas card competition as too 'cold', 'clinical' and 'objective', but decided to award it second prize anyway out of curiosity.
It took a while to realise the deeper connection between these two seemingly unrelated events, but they were my earliest first hand experiences of the great divide between scientific objectivity and artistic subjectivity, and it wasn't until I created 'Clouds, glands, tributaries' in 2007, that I felt I had struck a balance between these two philosophical ideals, and possibly found a way to combine them.
Over time I came to realise that the approach to creating drawing is almost identical to that writing of Japanese Haiku poetry. Unlike classical Chinese poetry, the Haiku poet must remain entirely objective whilst composing the three short lines of the poem. In a classic 'show, don't tell' fashion, if a poet makes the mistake of revealing their subjective feelings too directly then the poem fails as a haiku.
To my mind the true power of a haiku lies in the 'subjective void' left by the poet for readers to fill themselves. As a result, the effect of a successful haiku is fleeting but powerfully subjective, and much more than the sum of its objective observations. The best haiku, even in translation, are capable of subjectively connecting reader and writer across vast distances in time, space, culture and language, despite the suppression of subjective expression in favour of objective depiction.
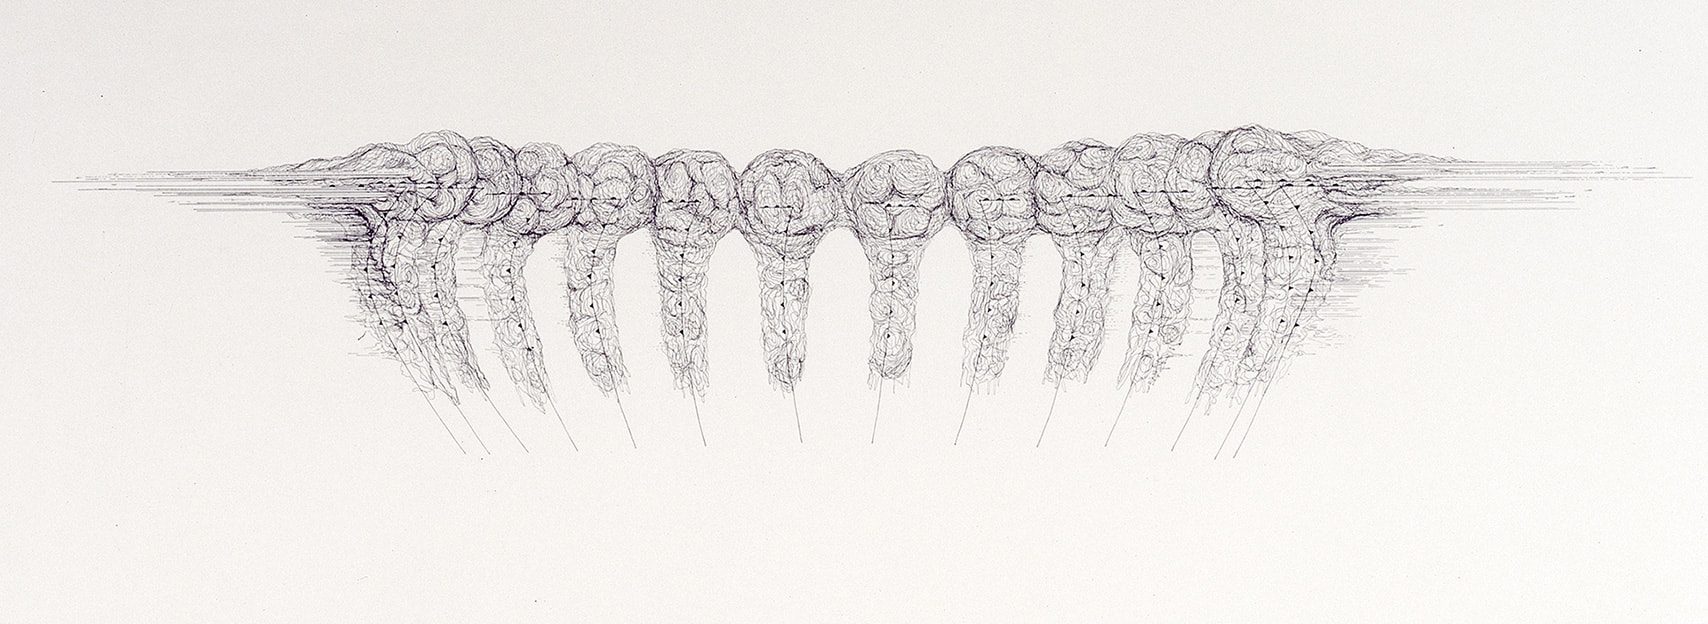
Image 2: Clouds, glands, tributaries (detail 1)
14 cyclones rotating towards the viewer, drawn as weather diagrams
14 cyclones rotating towards the viewer, drawn as weather diagrams
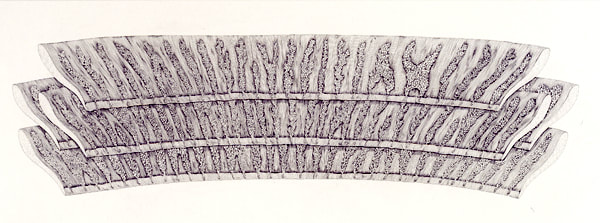
Considered as a visual haiku, 'Clouds, glands, tributaries' consists of three tiers of objective, scientific diagrams that are connected abstractly through notions of water. The top level depicts several storm clouds in the ‘Comma cloud pattern’, otherwise known as ‘Mid-latitude cyclones’ in American meteorological terms. These particular clouds also reference a season, as haiku should, in that the majority of Mid-Latitude cyclones occur in the winter.
| The cloud images are based on weather diagrams and employ the symbols for ‘cold front’ (colder air moving in the direction the triangles are pointing) and ‘warm front’ (warmer air moving in the direction the semicircles are pointing). Whereas weather diagrams depict such formations as maps viewed from above (i.e. by satellite imagery), in the drawing the clouds are positioned upright so that the cyclones rotate inwards toward the viewer. | 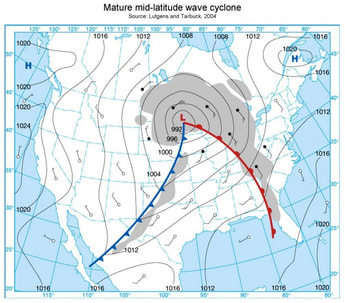 Image 3: Mature mid-latiude wave cyclone Source: Lutgens and Tarbuck, 2009 |
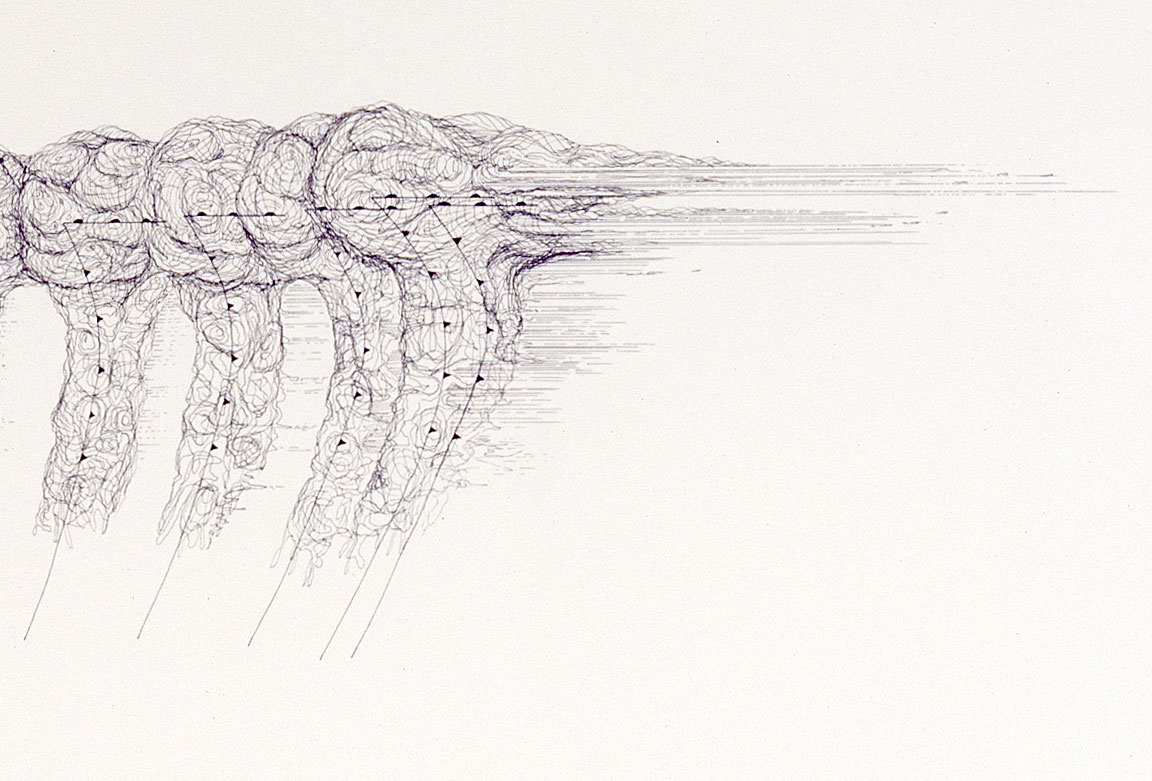
Image 4: Clouds, glands, tributaries (detail 2)
Collision of cold front and warm front as part of the formation of a cyclone
Collision of cold front and warm front as part of the formation of a cyclone
Beneath this layer, and on a very different scale, are drawn the Meibomian / Tarsal glands of the human inner eyelids. These specialised sebaceous glands secrete meibum along the rim of the eyelids inside the ‘tarsal plates’ (eyelids).
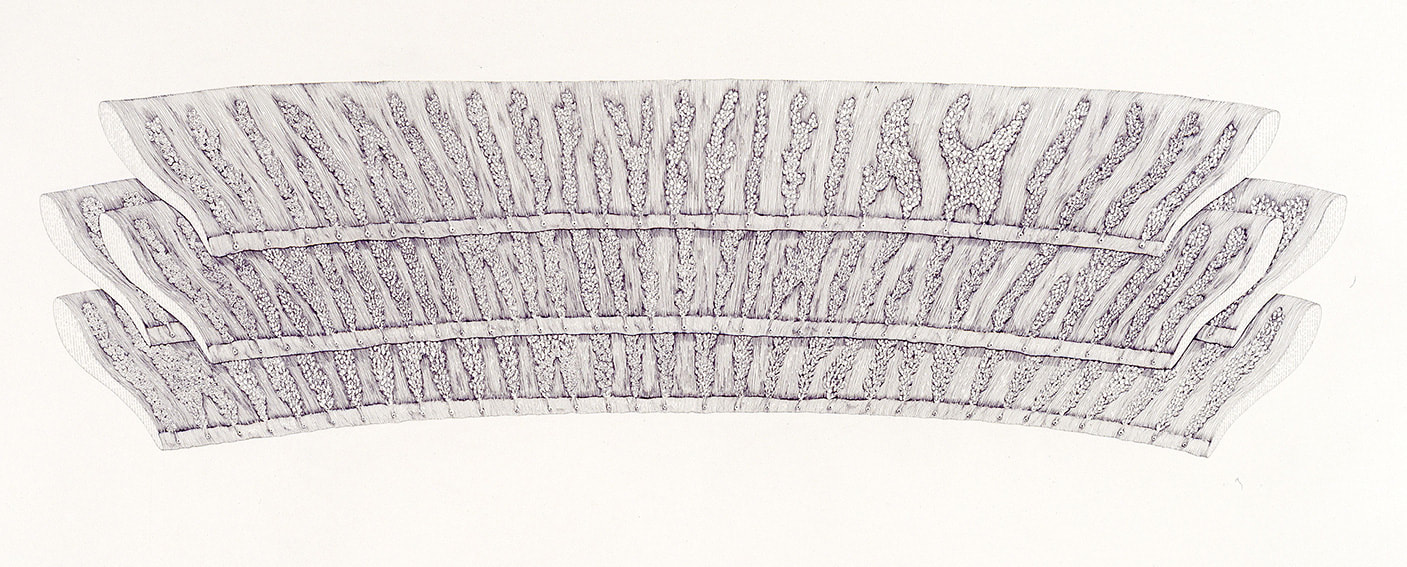
Image 5: Clouds, glands, tributaries (detail 3)
four inner eyelids complete with Meibomian (tarsal) glands
four inner eyelids complete with Meibomian (tarsal) glands
Meibum is complex mixture of lipids that forms an oily layer trapping an aqueous layer of tears that coats the surface of the human eye. Composing the outer most layer of the 'precorneal film', meibum prevents the evaporation of tears as well as their spillage onto the cheeks, and create a delicate airtight seal when the lids are closed.
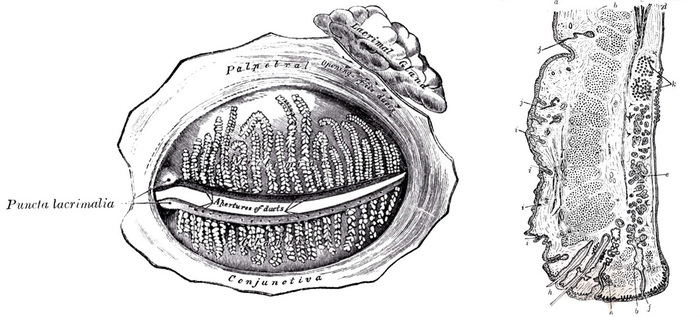
Image 6: Medical diagram of the inner eyelids showing Meibomium (tarsal) glands and their ducts,
and also the Lacrimal gland which creates tears. (frontal view and cross section)
and also the Lacrimal gland which creates tears. (frontal view and cross section)
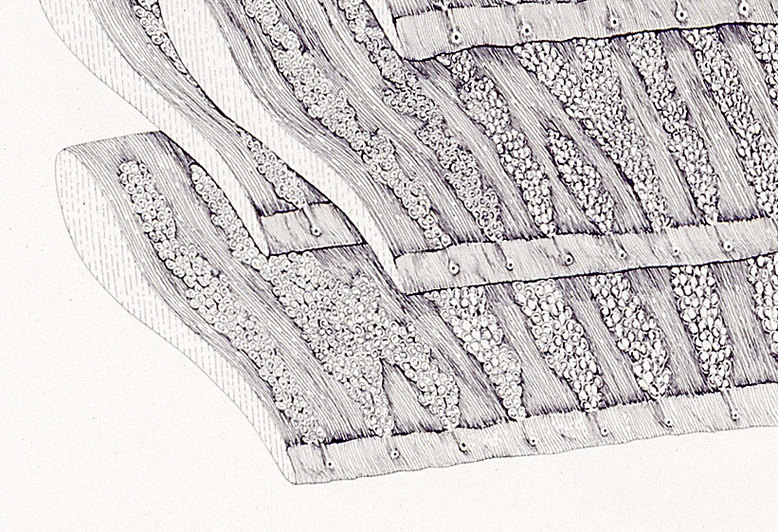
Image 6: Clouds, glands, tributaries (detail 4)
Inner upper eyelids complete with meibomian (tarsal) glands and ducts
Inner upper eyelids complete with meibomian (tarsal) glands and ducts
In 'Clouds, glands, tributaries', four distinct superior tarsal plates (upper eyelids) are depicted overlapping one another, with the ducts of the glands pointing downwards towards a semi-circular river valley and floodplain beneath.
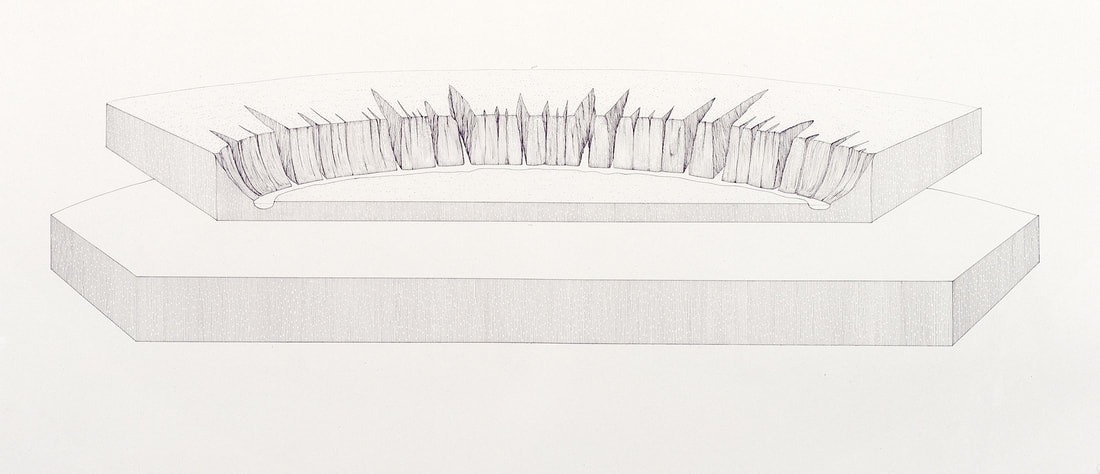
Image 7: Clouds, glands, tributaries (detail 5)
diagram depicting the theory of river tributary formation and flood plain
diagram depicting the theory of river tributary formation and flood plain
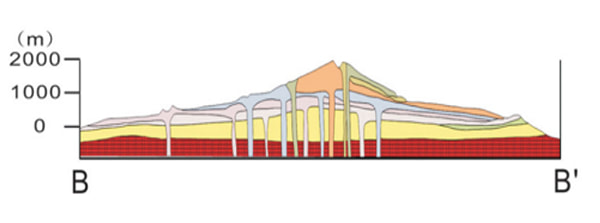
This base layer shifts upwards in scale to depict two sheets of bedrock at the surface of the earth's crust. These geological cross sections show before (lower plate) and after (upper plate) images of erosion caused by both a river and the elements, to create various V-shaped valleys on the opposite bank to the floodplain.
The drawings are based on the geological theory for the formation of river tributaries which suggests that over a period of geological time, small irregularities in the valley wall are eroded by running water to create fissures that gradually extend back into the surface of rock face into vast and complex river networks.
The drawings are based on the geological theory for the formation of river tributaries which suggests that over a period of geological time, small irregularities in the valley wall are eroded by running water to create fissures that gradually extend back into the surface of rock face into vast and complex river networks.
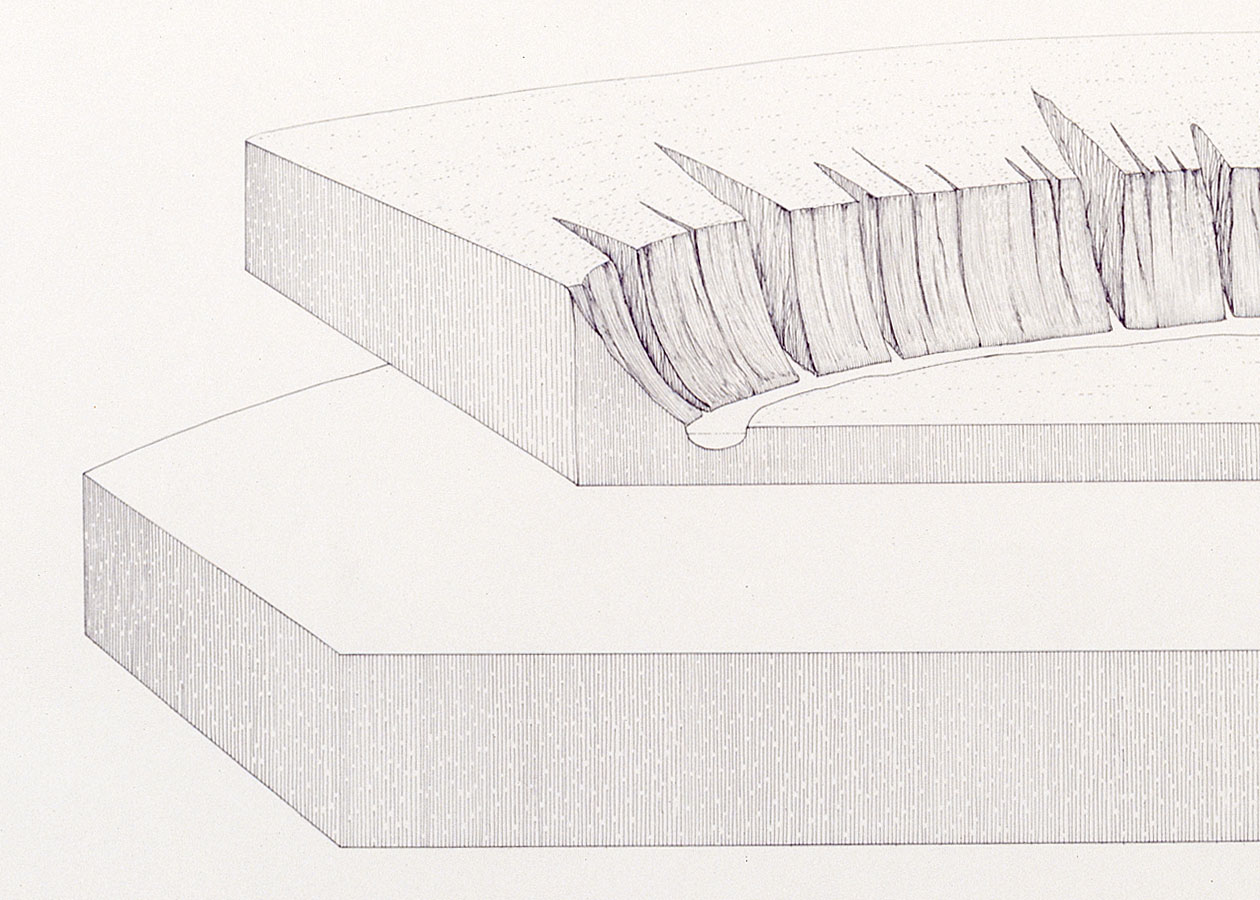
Image 8: Clouds, glands, tributaries (detail 6)
diagram depicting the theory of river tributary formation
diagram depicting the theory of river tributary formation
The three levels of the drawing 'Clouds, glands, tributaries' all indirectly reference water through a number of processes acting at different scales. The cyclonic clouds of water vapour are an emergent property of countless water droplets marshalled into an organised process by the collision of cold, dry air with warm, moist air, creating structures between 1500-5000 km in diameter, far larger than a hurricane or tropical storm.
The Meibomian / Tarsal glands secrete an oil that traps the 'tear film' against the surface of the eye. This creates a miniscule layer of salt water 0.003 mm thick, through which we view the world. The geological layer beneath this depicts an erosion pattern arising as a result of water draining from the land into a river system.
Two other aspects of water are present only by suggestion, the raindrops from the storm clouds and tears from the eyes, and both of these play off the idea of erosion over time on the landscape beneath. The spherical ball of an eye is also suggested by the spherical, negative space created by each of the three layers, in particular the four, overlapping, upper eyelids.
To use Umberto Eco's terms, 'Clouds, glands, tributaries' is an open work in with no definitive reading. Like Marcel Duchamp's 'Large Glass' ('The Bride Stripped Bare by Her Bachelors, Even'), the title provides important clues but specific details remain hidden unless the viewer has some knowledge in meteorology, biology or geology.
Duchamp proposed thought of a painting's title as "another colour on the artist’s palette", and his use of obscure references in 'The Large Glass' was accompanied by volumes of notes published both during his lifetime and afterwards as an encyclopaedic reference system to 'The Large Glass'. The disconnected and vague nature of the notes however only acts to add yet another layer of abstract meaning to be deciphered, as part of a cryptic game that has occupied a whole generation of Duchamp scholars.
'Clouds, glands, tributaries' relies upon specialised knowledge to recognise the specific nature of the diagrams being used as the title gives no suggestion as to what type of cloud, gland or tributary the viewer is looking at, so that the references risk being lost in ambiguity.
In order to avoid this problem the titles of later works employ more specific scientific terminology, to act as a set of keys to access the concepts being referred to. Instead of having to refer to volumes of notes to read each drawing however, an inquisitive viewer can check the terms used in a title using their smartphone, and in this way each person can develop their own reading of a work and draw their own conclusions, thanks to the ever increasing intelligence of search engines, and the vast, interconnected hypertext of the internet.
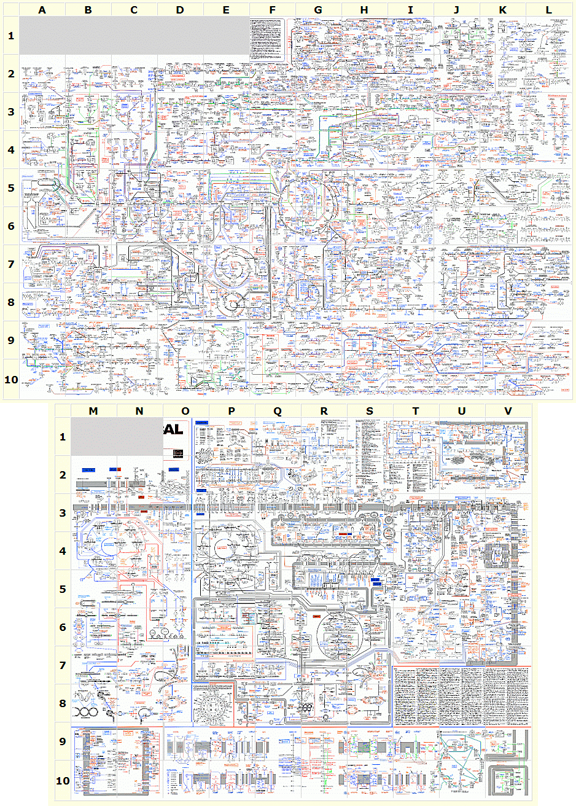
To see just how subtle, intricate and profound biochemical pathways really are, it's worth following the link below to two of my favourite diagrams of all times. Compiled by Gerhard Michal of the Boehringer Mannheim company, they were originally published as huge wall posters, but are now available for free in an online, interactive form.
The two charts 'Biochemical Pathways' and 'Cellular and Molecular Processes', are both daunting in their scale and beauty, but it's worth remembering that if every known molecule within the human cell were to be included on a chart at this scale, it would need to be far larger than a football pitch in size (and probably 3-D).
Click on the images below to access the online versions of the charts:
Dr. Michael Whittle
British artist and
researcher based
in Macau
Posts:

Categories
All
Alchemical Art
Anatomy
Arakawa And Gins
Architecture
Bauhaus
Contemporary-art
Contemporary-art
Duchamp
Genetics
Geology
Geometry
JMW Turner
Leonardo Da Vinci
Literature
Mathematics
Medieval Art
Musicology
Oskar Schlemmer
Perspective
Physics
Romanticism
Sol LeWitt
Surrealism
Theatre
Archives
April 2024
December 2023
November 2023
September 2023
June 2022
June 2021
August 2020
October 2019
August 2018
January 2018
November 2017
October 2017
April 2017
November 2016
October 2016
September 2016
June 2016
May 2016
April 2016
March 2016