|
❉ This is the seventh in a series of blogs that discuss diagrams in the arts and sciences. I recently completed my PhD on this subject at Kyoto city University of the Arts, Japan's oldest Art School. Feel free to leave comments or to contact me directly if you'd like any more information on life as an artist in Japan, what a PhD in Fine Art involves, applying for the Japanese Government Monbusho Scholarship program (MEXT), or to talk about diagrams and diagrammatic art in general. 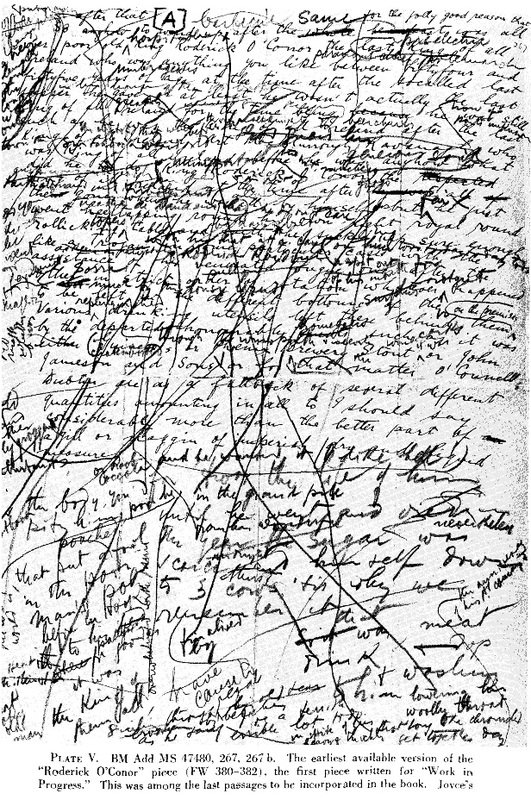 Figure 1: The earliest surviving draft of James Joyce's "Roderick O'Conor" piece, covered in Joyce's own revisions, from David Hayman's A First Draft Version of Finnegans Wake. Literature and literary texts aren't normally associated with diagrams, mainly because of the linear nature of the reading process itself. However non-linear texts with complex narratives, plots and story structures almost automatically become diagrammatic, and rely on a variety of diagrammatic processes to both create and understand them. The illustration above gives a glimpse into the intricate web of ideas created by James Joyce during the writing of his experimental and difficult novel Finnegans Wake, first published in 1939. In one of the most dense and convoluted plots in literary history, readers are left with the impression that events are happening simultaneously thanks to Joyce's use of multiple, interconnected and disjointed narratives. The Irish experimental poet Billy Mills described it as "the book the web was invented for", proposing that by taking in to account music, the act of reading-aloud and contemporary digital technologies we are able to open up rich new interpretations of the text that have much more in common with encyclopedias and web hypertexts than the conventional format of the novel. (1) Mills article can be found here.
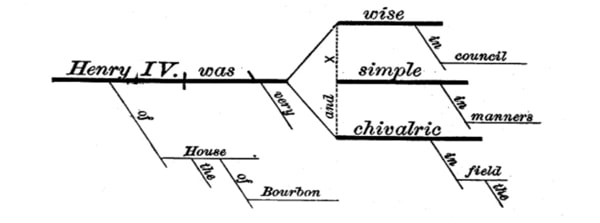
Mills highlights just how important the diagram was to Joyce's work both as an engine of creation and the means by which readers attempt to decode the work and investigate its labyrinth of references, puns and wordplay. An annotated online version of the text can be found here.  Figure 2: László Moholy-Nagy's diagram of Finnegan's Wake, 1946, from 'Vision in Motion', Chicago. The Hungarian born artist László Moholy-Nagy, created a diagram of the themes of Finnegans Wake with Joyce (JJ) positioned as the pivotal point of a wheel like structure. The four concentric circles represent Giambattisata Vico's theory of history, and the columns on the left show various 'levels' such as: familial, historical, mythological, cabalistic, biblical, symbolistic, etc. Column headers contain the characters HCE (H.C. Earwicker), ALP (Anna Livia Plurabella) and their children. The spokes of the wheel that pass through the various layers of narrative suggest further interconnections within the text, based upon the signs of the zodiac, the four evangelists and Phoenix park in Dublin etc. It's easy now to imagine an interactive, three dimensional version of Moholy-Nagy's diagram, connecting its users via encyclopedic hyper links to important images, texts and music referenced by Joyce. 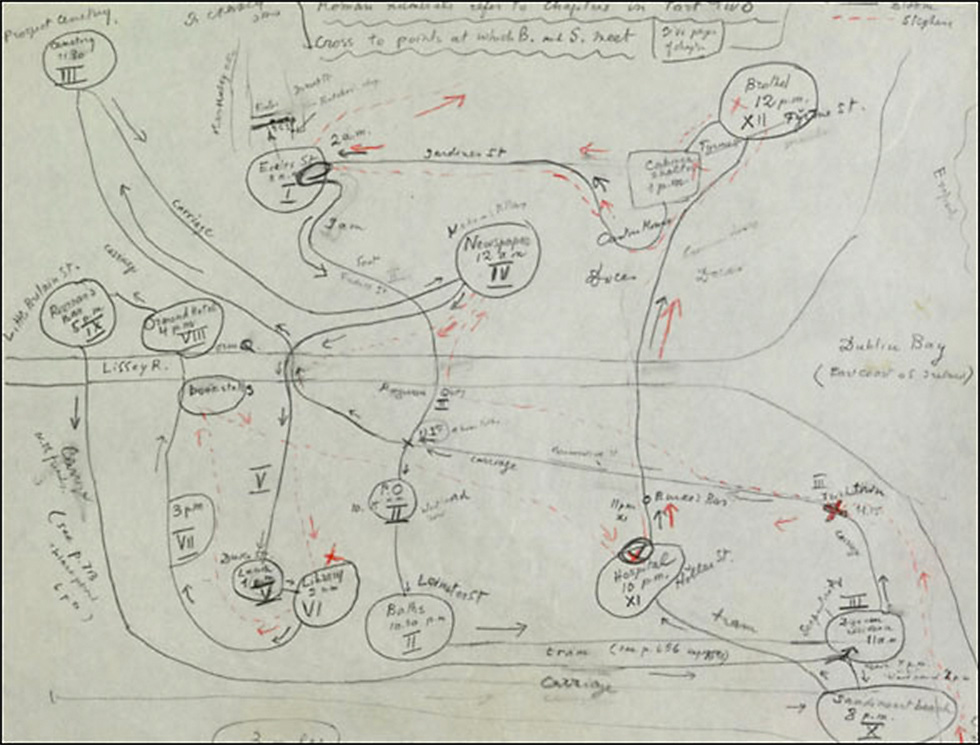 Figure 3: Vladimir Nabokov's diagram tracking the paths Stephen Dedalus and Leopold Bloom took through Dublin on June 16, 1904, in Joyce's masterwork Ulysees. Vladimir Nabokov detested what he called "Punningans Wake", refering to it as a "cancerous growth of fancy word-tissue" consisting of the "dreadful joviality of the folklore and the easy, too easy, allegory." (3) However Nabokov considered Joyce's novel Ulysees as brilliant, lucid, and some kind of 'Great Machine' (4). Nabokov even went so far as to diagram the route that Stephen Dedalus and Leopold Bloom took through Dublin on June 16, 1904, as part of his lectures notes for Ulysees, and suggested to those who teach Ulysses that: “Instead of perpetuating the pretentious nonsense of Homeric, chromatic, and visceral chapter headings, instructors should prepare maps of Dublin with Bloom’s and Stephen’s intertwining itineraries clearly traced.” If Narrative is taken to be the structure of events — the architecture of the story, and Story is the sequence of events, the order in which the narrative occurs — the tour through the building, then Plot is the sum of the events, told not necessarily in sequential order, but generally consistent with the story and often considered synonymous with the narrative — the building itself. The American novelist Kurt Vonnegut proposed that there are in fact only a very limited number of underlying plots to all of the stories which we tell ourselves, and all can be depicted using simple diagrams. Vonnegut submitted his idea as his 1969 Masters Thesis at the University of Chicago, but it was rejected at the time as being overly simplistic. However Vonnegut persisted with the idea, eventually representing his thesis as a series of lectures, and extract is show in the video below: Figure 5: Kurt Vonnegut lecturing on 'The Shape of Stories' 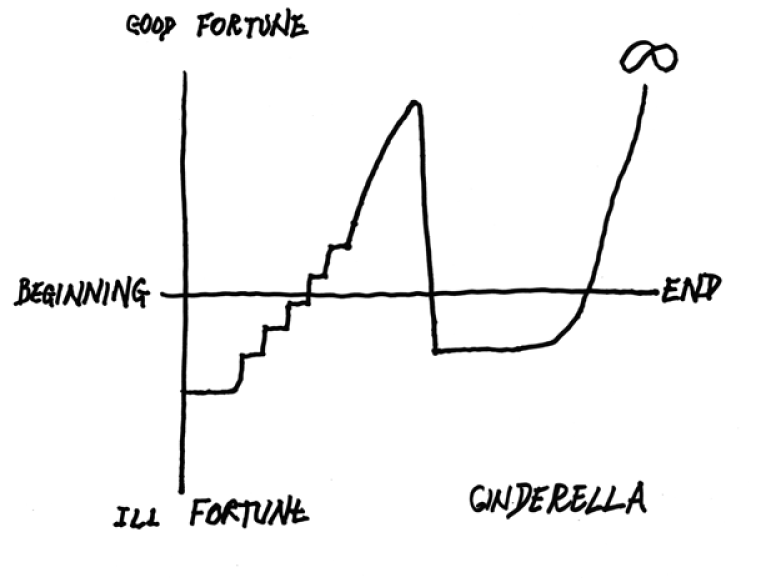 Figure 6: Kurt Vonnegut's diagram of the plot of the story Cinderella, with an x-axis = time, and y-axis = fortune In the case of the story of Cinderella, Vonnegut recognised a deep structural similarity between it and the plot of the new testament. In both cases, the protagonists receive incremental gifts from a spirit or deity, experience a sudden fall from grace, only to rise again to experience off the chart levels of bliss and good fortune. Vonnegut suggested several other distinct patterns that he named 'Man in a hole' (fall-rise), 'Boy meets girl' (fall-rise-fall), 'Kafka' (an infinite fall described by Vonnegut as 'a pessimistic story'), and 'Hamlet', whose situation is the same as Cinderella’s, except that the sexes are reversed. However Vonnegut proposes that Shakespeare's master-piece leaves us uncertain as to what is good and what is bad news, and opts to leave the graph empty. 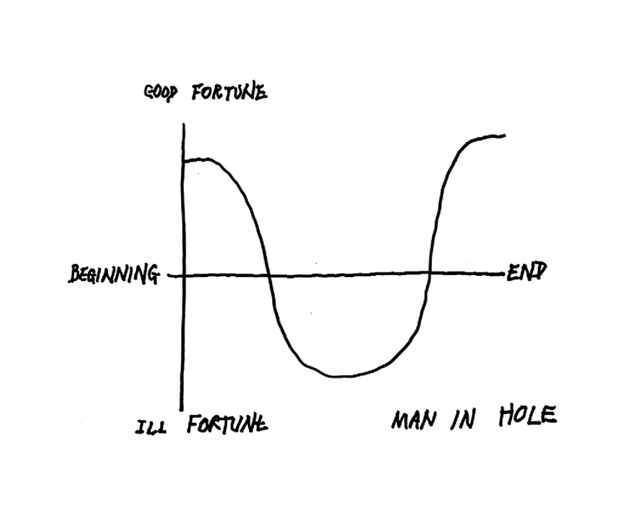 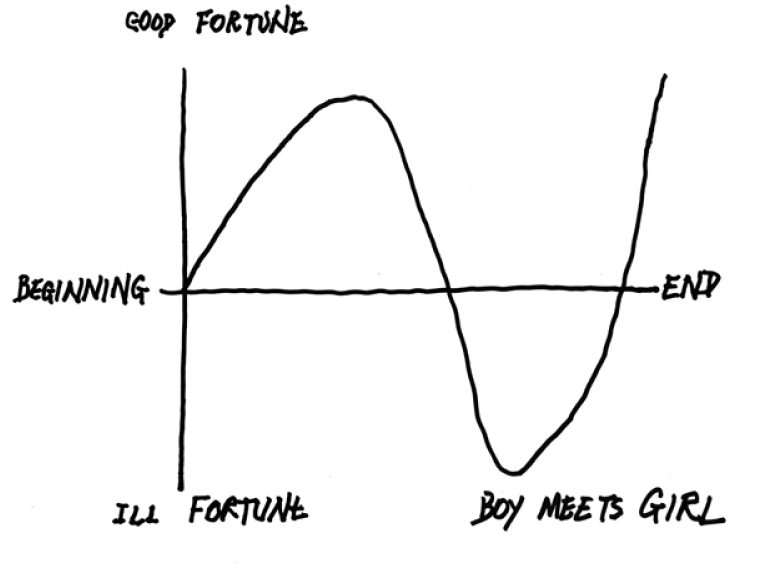  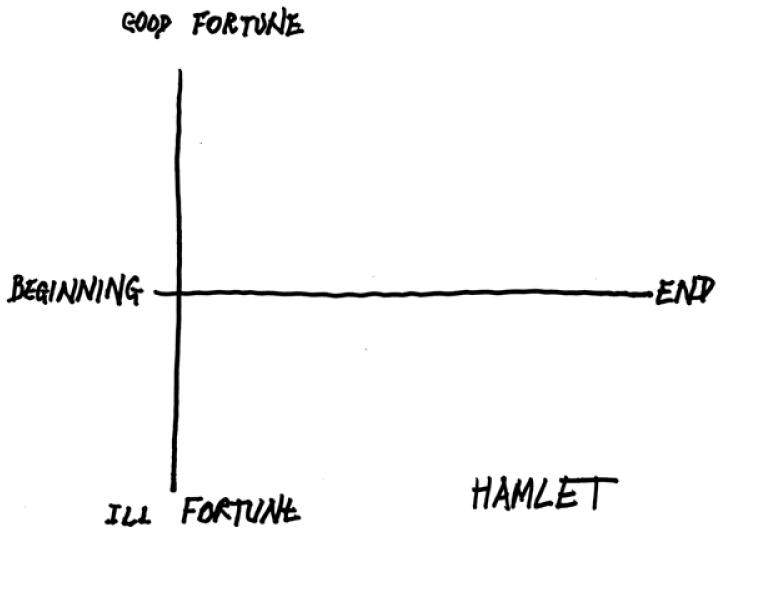 Figures 7-10: Kurt Vonnegut's plot diagrams, first developed in 1949 as part of his Masters Thesis. In order to take a closer look at the structure of literature and thus of text itself, Alonzo Reed and Brainerd Kellogg developed a novel diagrammatic system in the 1860's and 70's, now known as Reed-Kellogg diagrams. As pedagogical tools these diagrams capture a number of important features of sentence structure in a clear visual layout that highlights the core of the sentence and how other elements relate to that core. 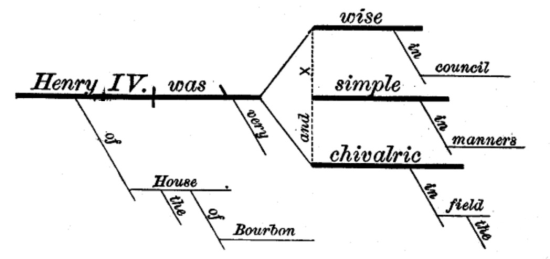 Figure 11: Sentence diagram from Reed and Kellogg, Graded Lessons in English, p. 60 Reed-Kellogg diagrams make use of font size, line weight and angle and a number of other codes which must be learnt in order to decipher their meaning. They were by no means the first or most definitive system to dissect and display grammar for educational purposes, and modern linguistics also uses tree-diagrams to analyse sentence structure. The Reed-Kellogg method, however, provides a compact and aesthetically pleasing diagrammatic means of breaking down sentence components for educational analysis, and the following are a series of opening sentences from famous novels, compiled by the infographics company 'Pop Chart Lab', titled “A Diagrammatical Dissertation on Opening Lines of Notable Novels.” More information is available at popchartlab.com   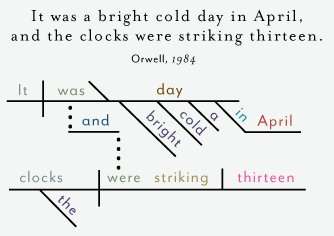 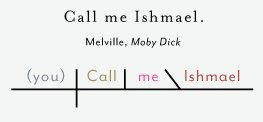 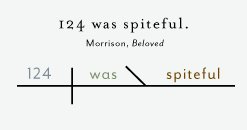 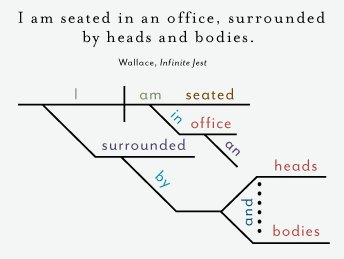 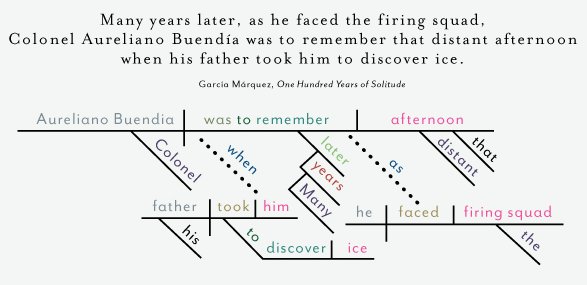 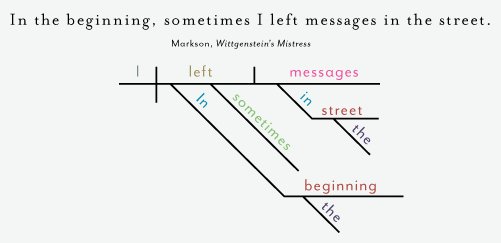  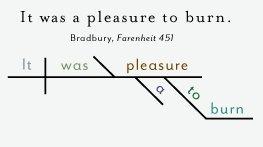 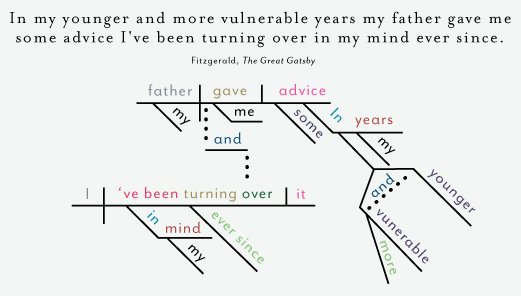 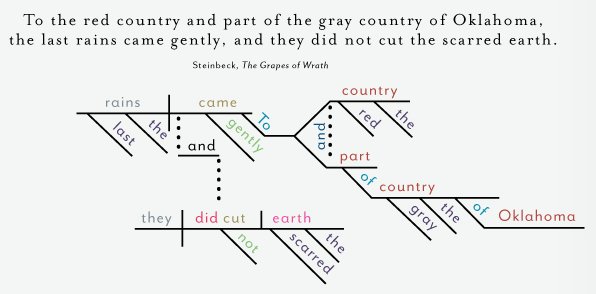 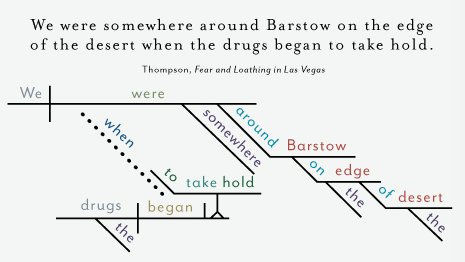 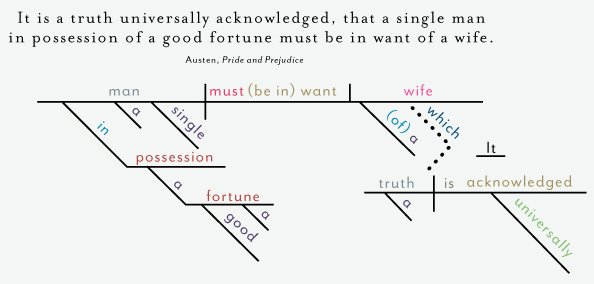  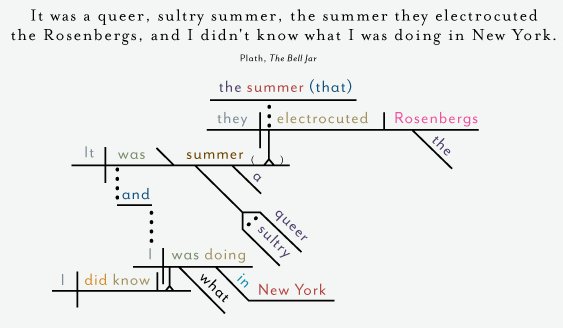  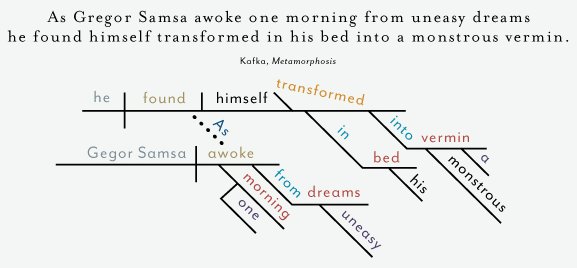 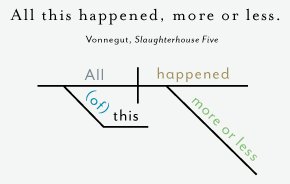 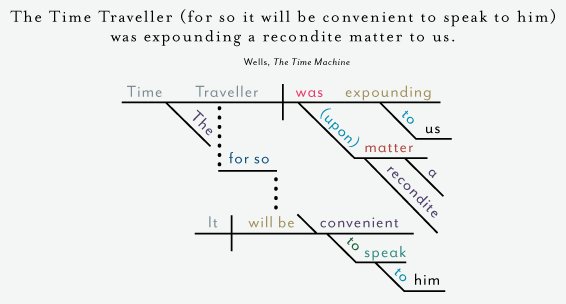 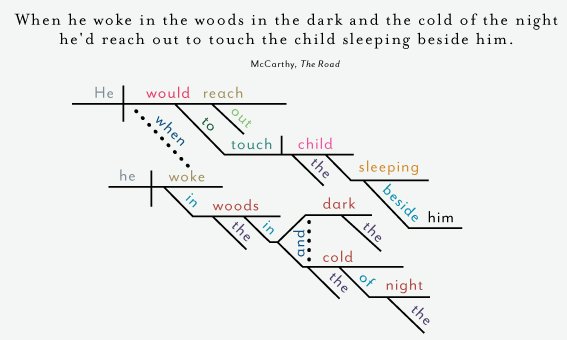 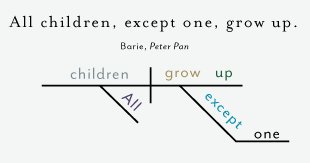 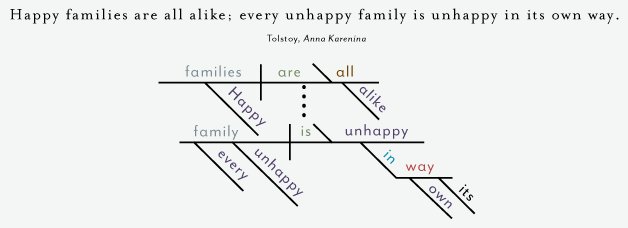 References:
1)Billy mills, Finnegans Wake – the book the web was invented for, Online: The Guardian, April 28th, 2015. (Available here) 2)Ibid. 3) Vladimir Nabokov in interview: http://www.theparisreview.org/interviews/4310/the-art-of-fiction-no-40-vladimir-nabokov 4) Ibid.
4 Comments
❉ This is the sixth in a series of blogs that discuss diagrams in the arts and sciences. I recently completed my PhD on this subject at Kyoto city University of the Arts, Japan's oldest Art School. Feel free to leave comments or to contact me directly if you'd like any more information on life as an artist in Japan, what a PhD in Fine Art involves, applying for the Japanese Government Monbusho Scholarship program (MEXT), or to talk about diagrams and diagrammatic art in general. 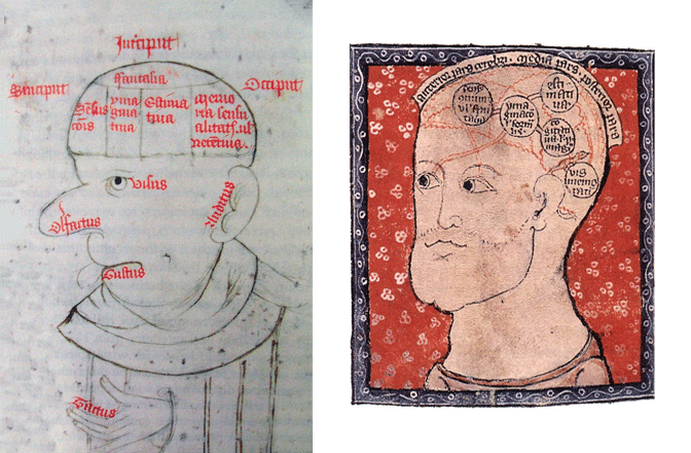
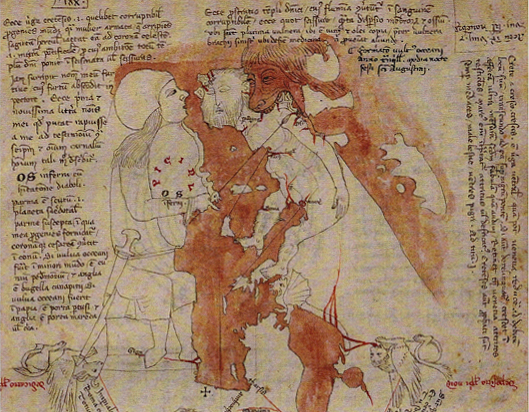
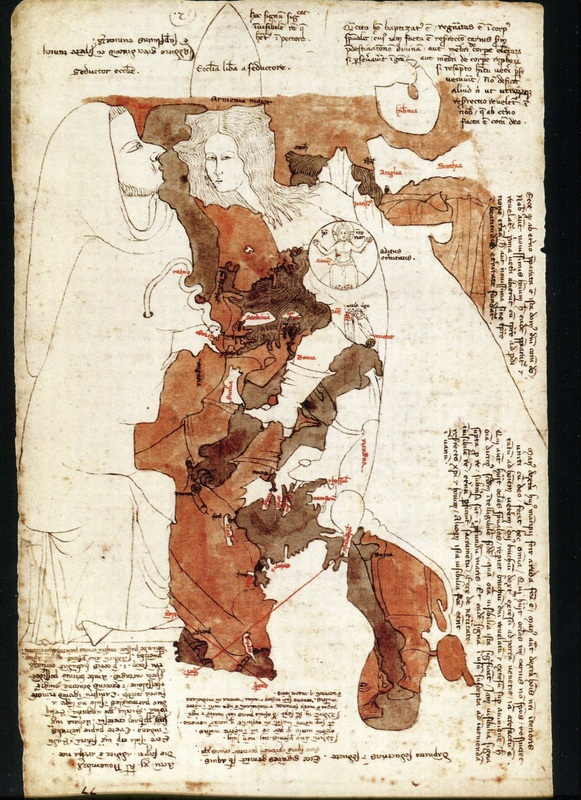
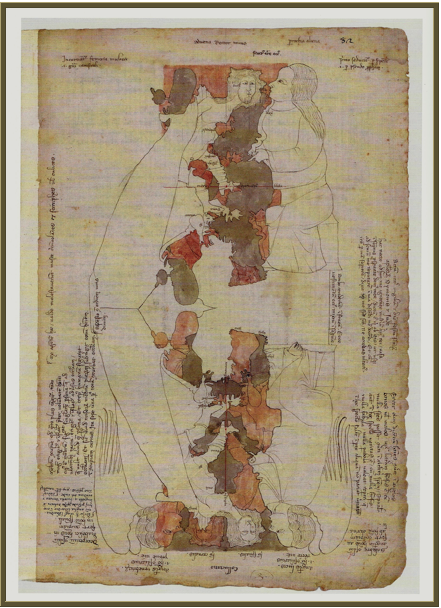
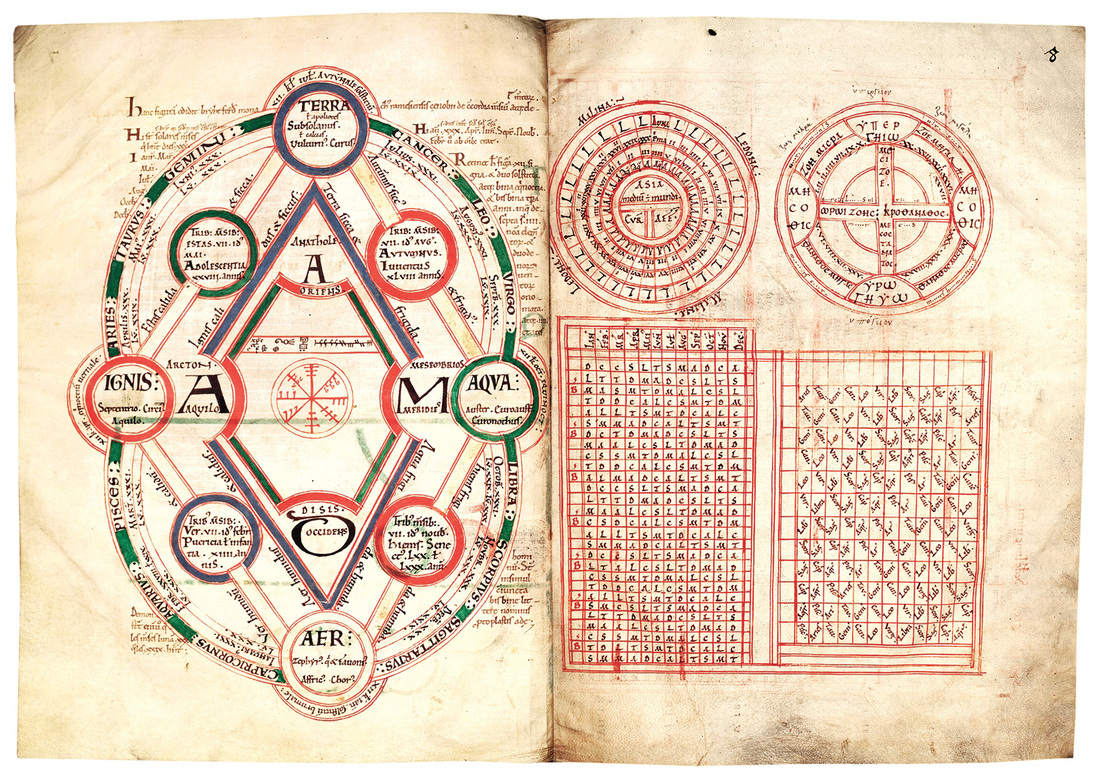
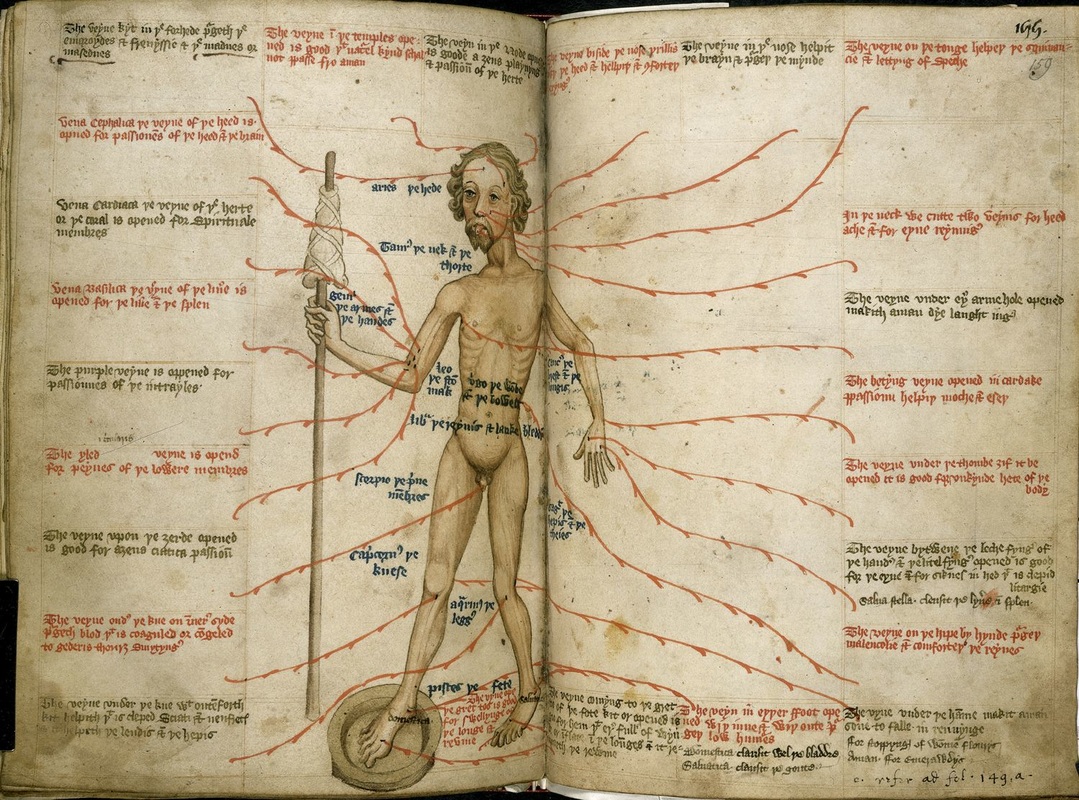
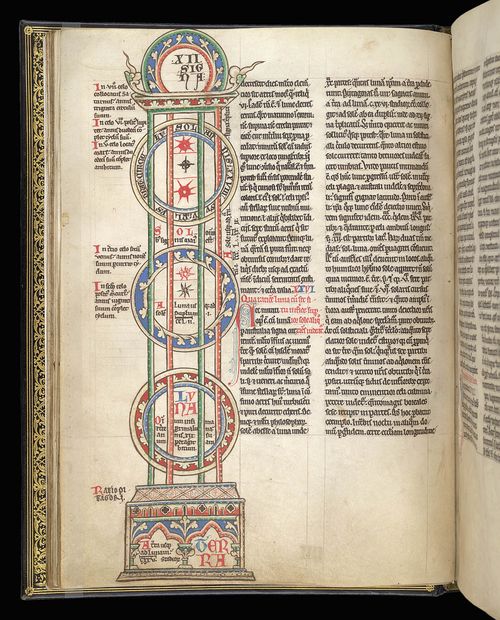
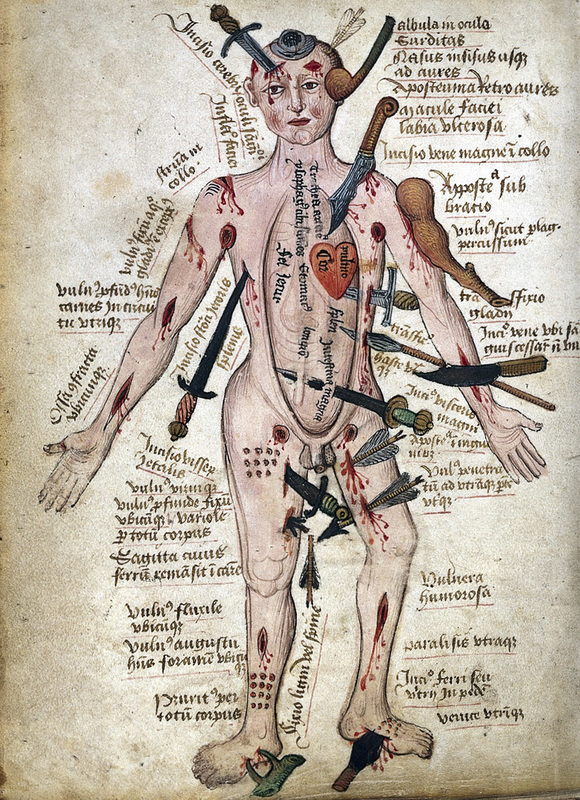
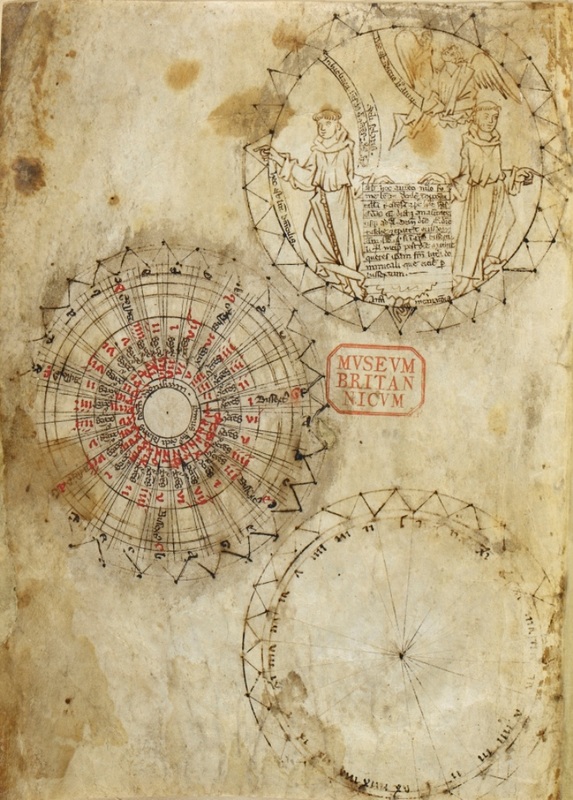
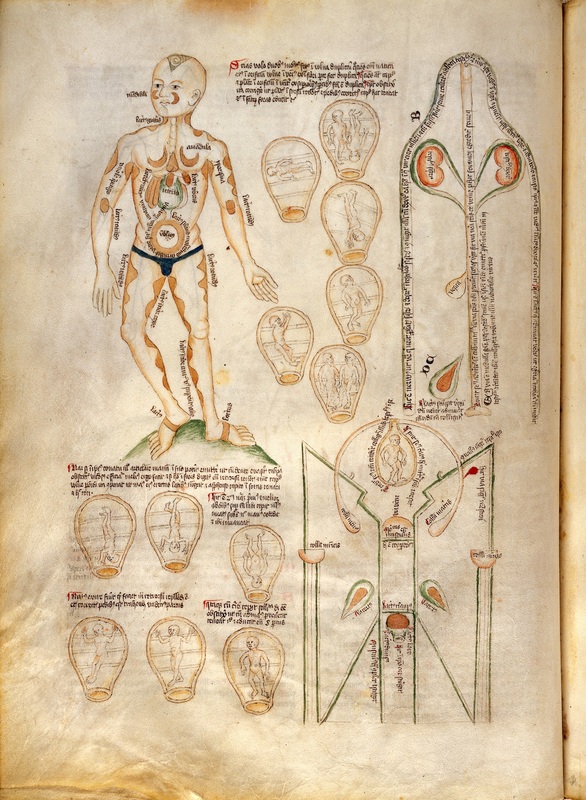
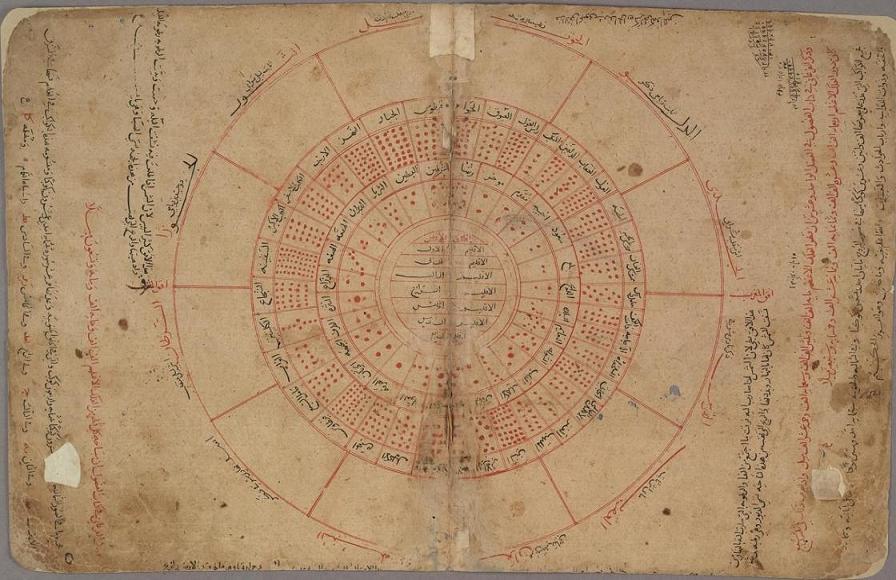
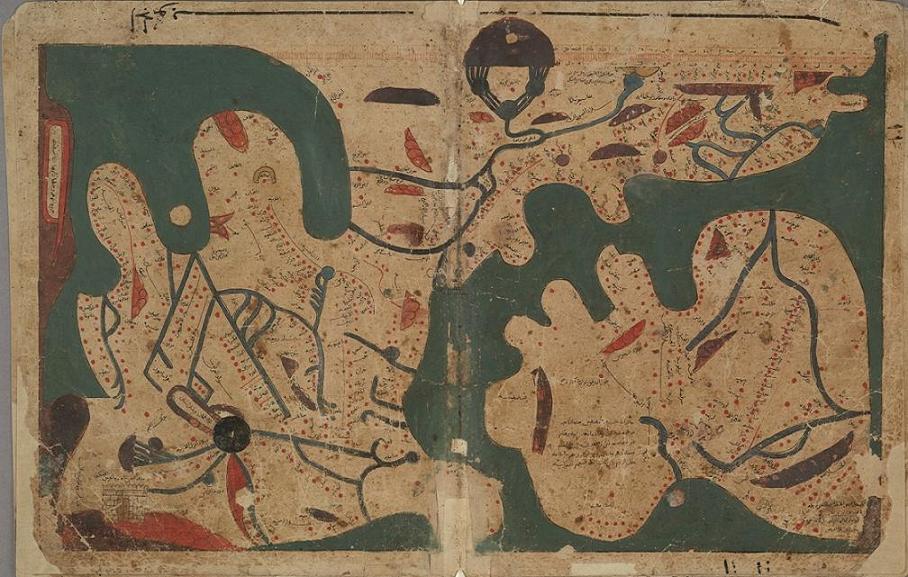
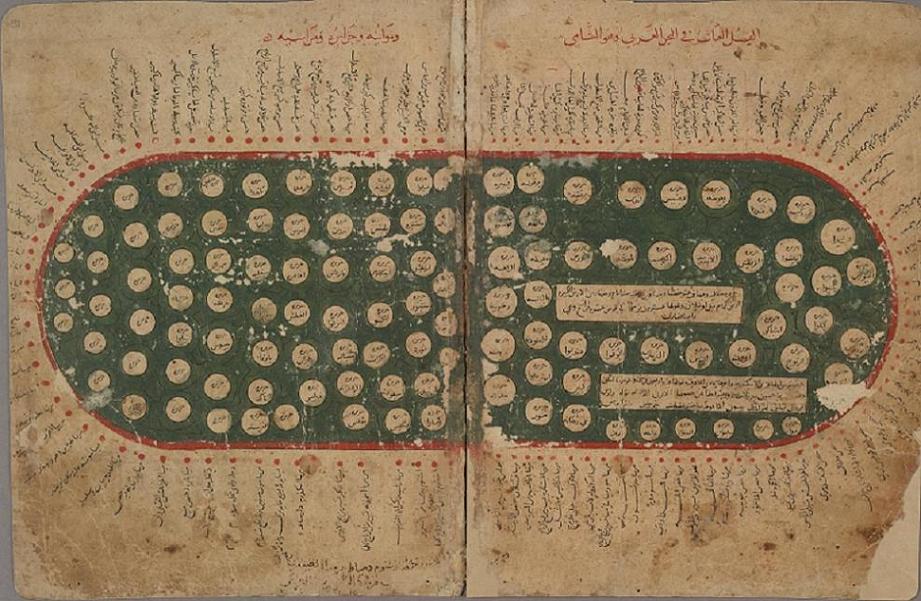
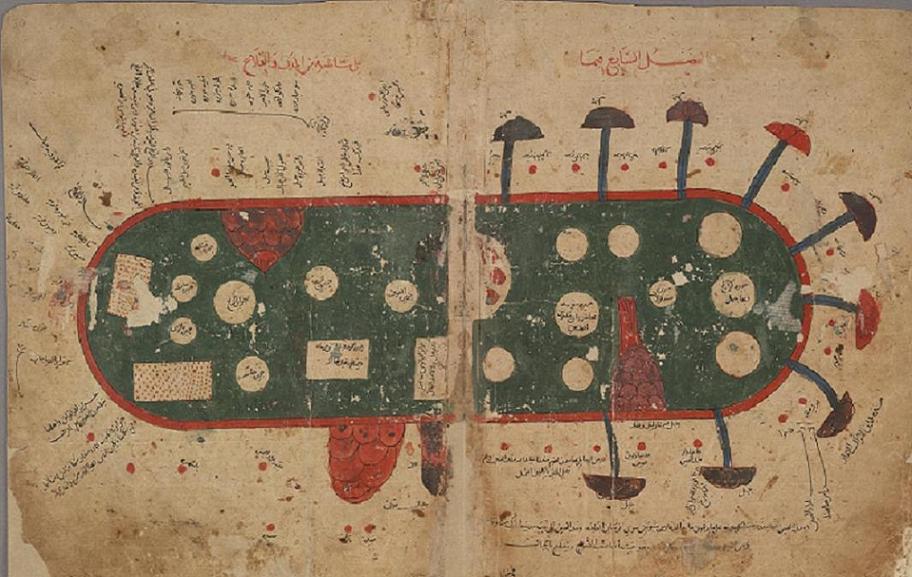
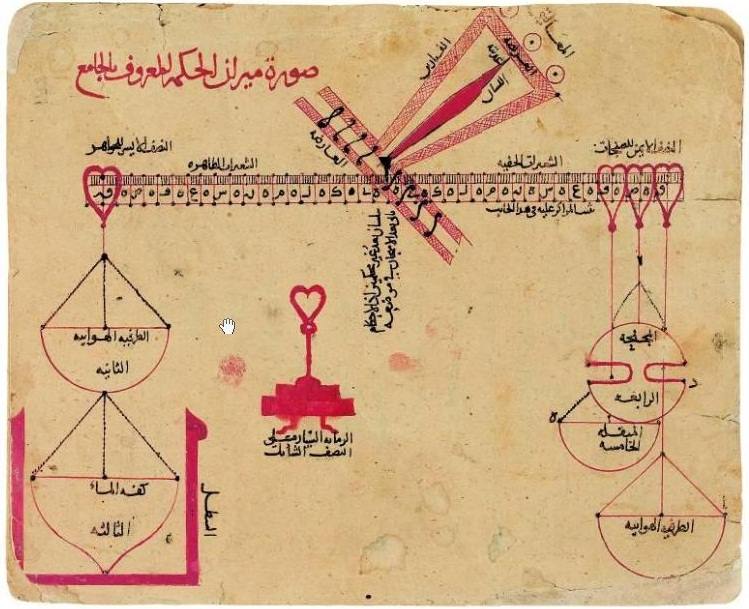
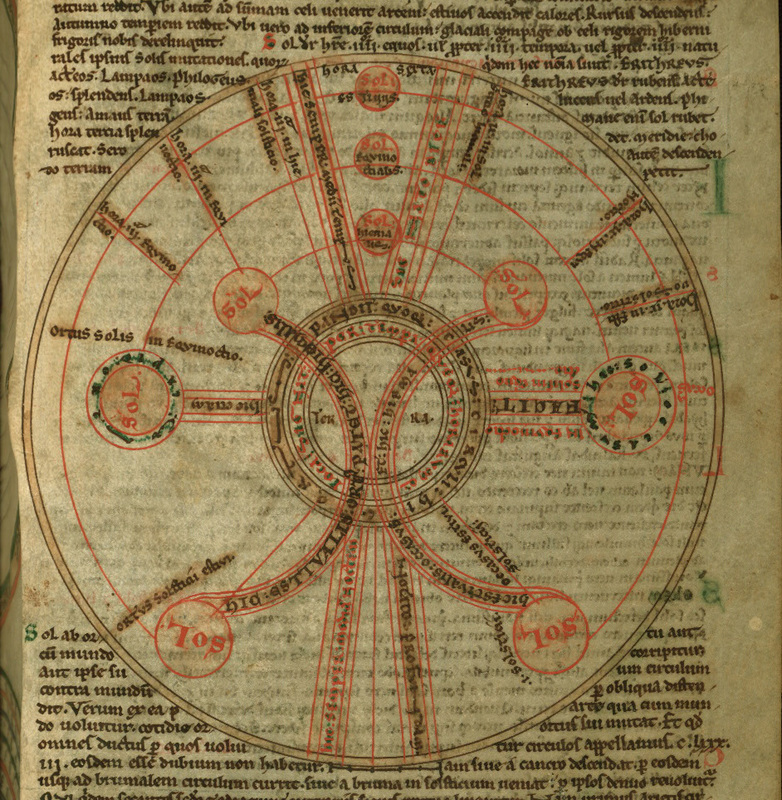
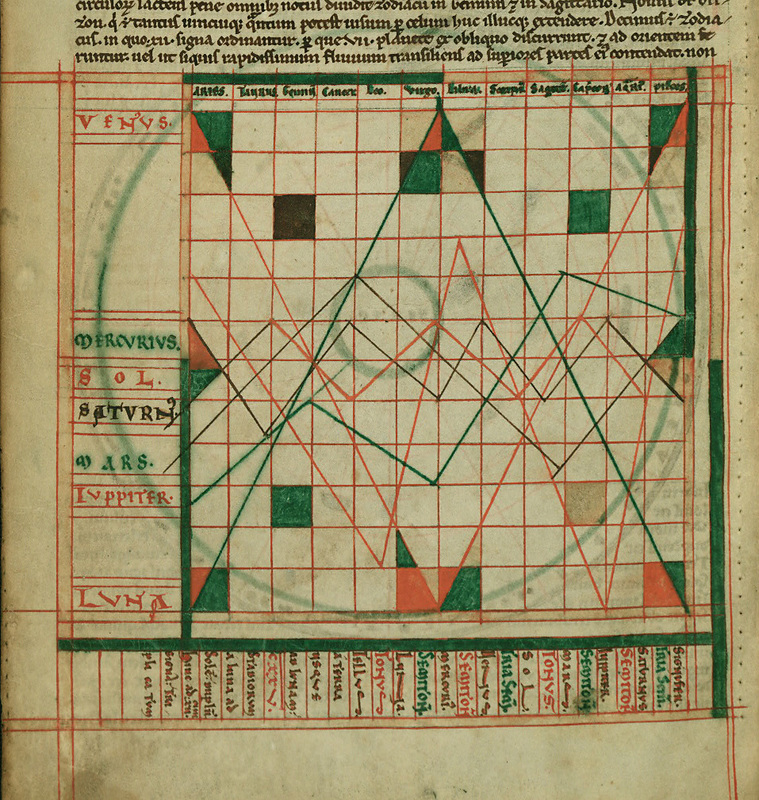
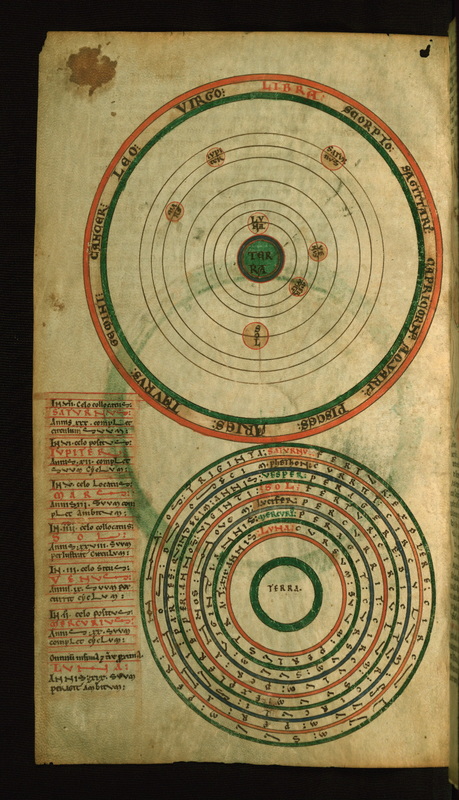
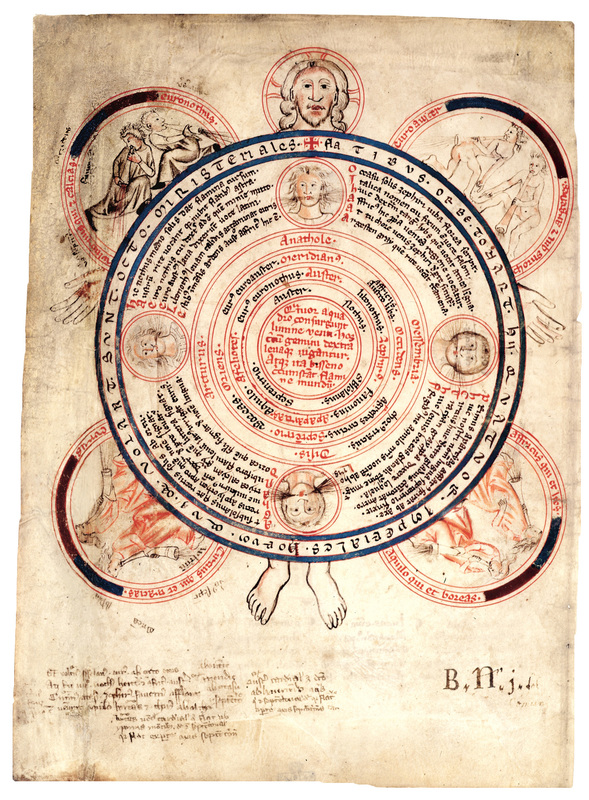
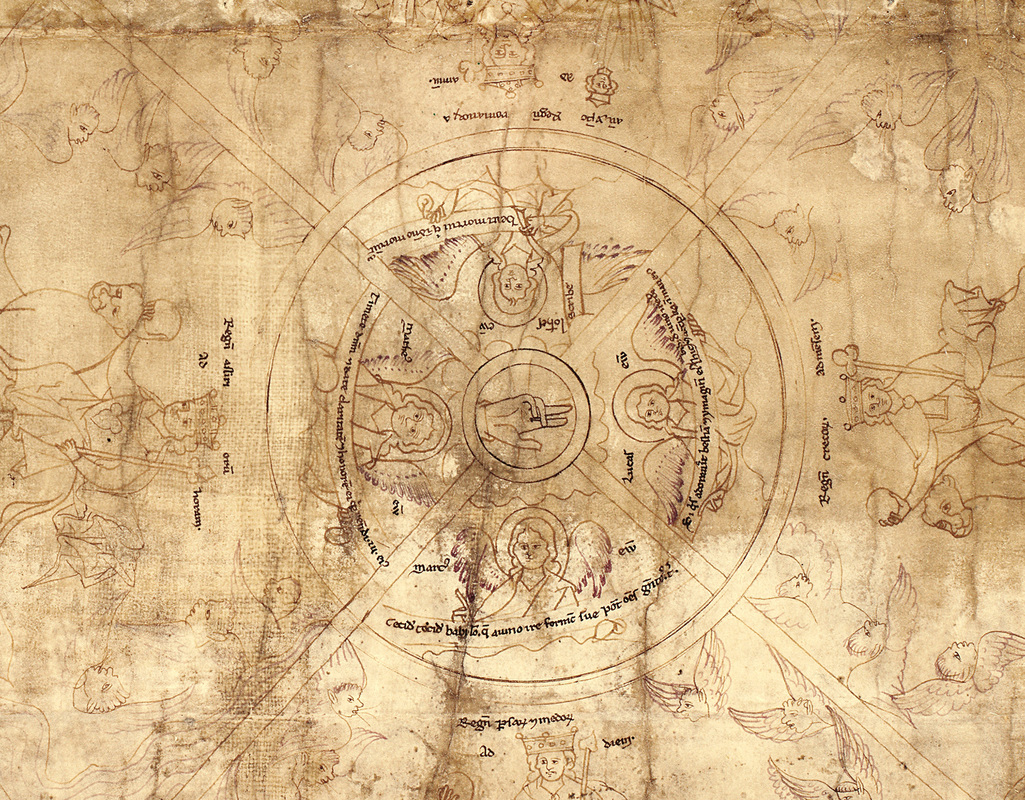
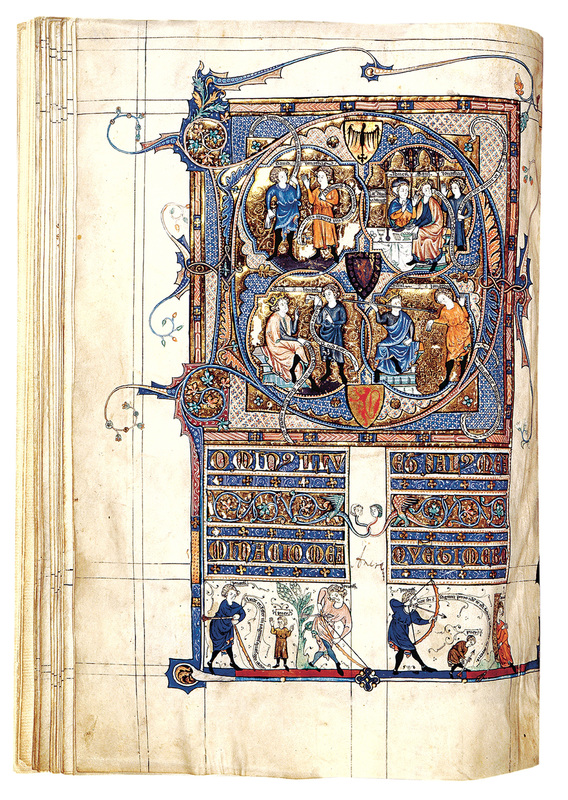
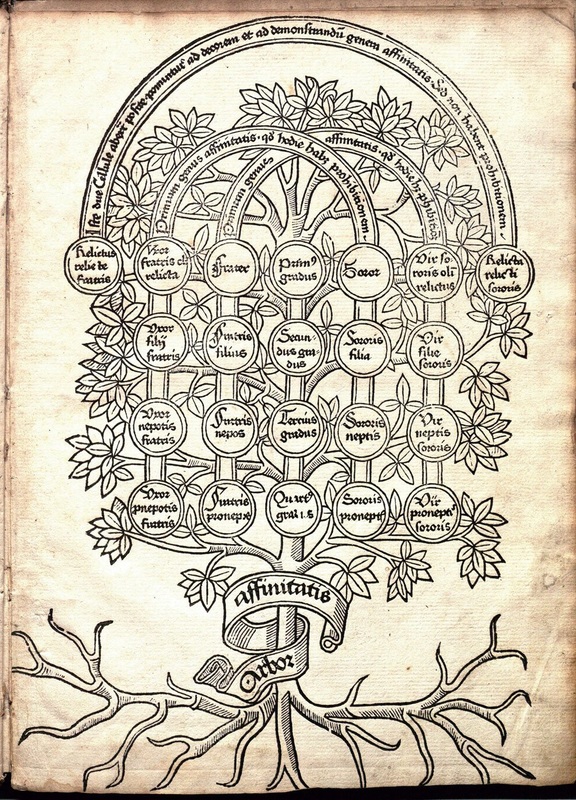
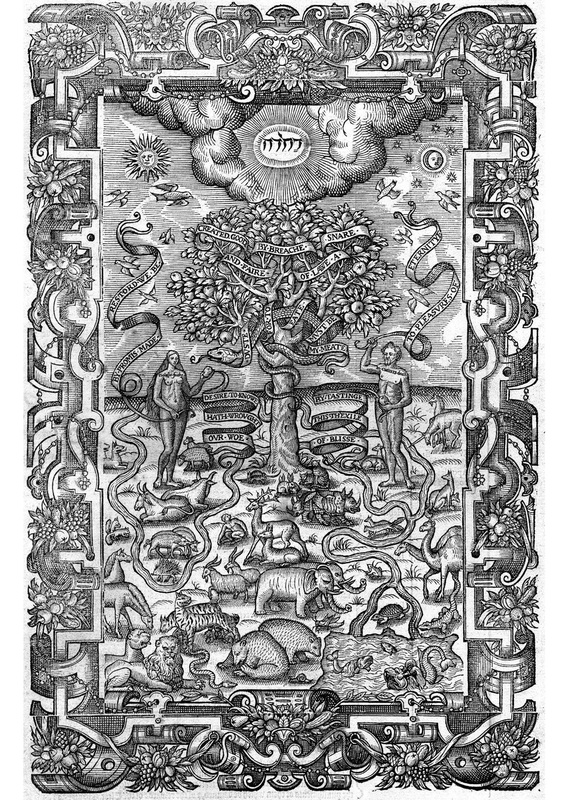
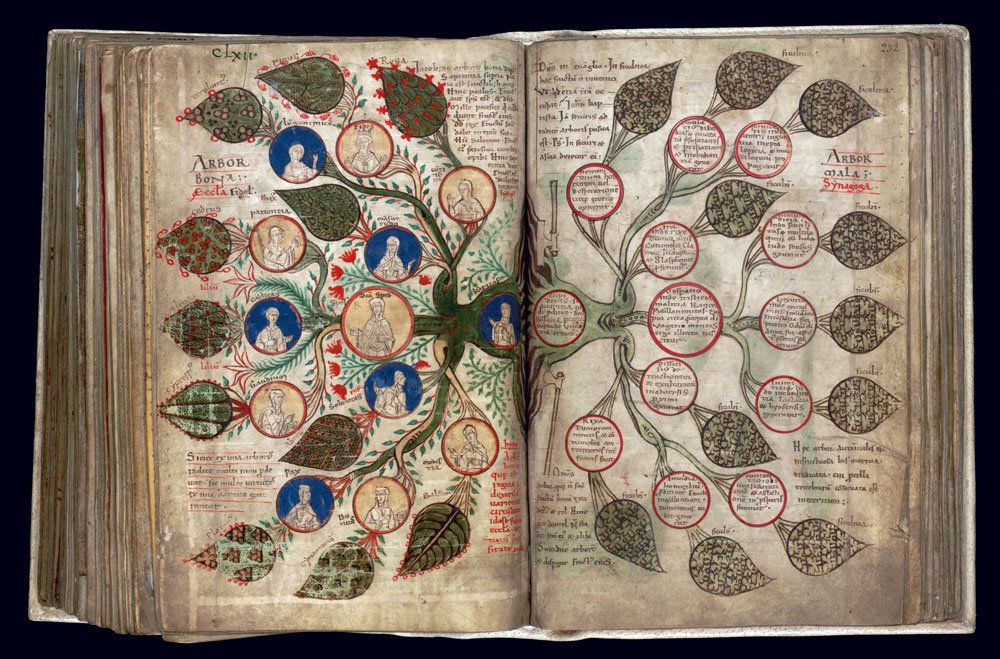
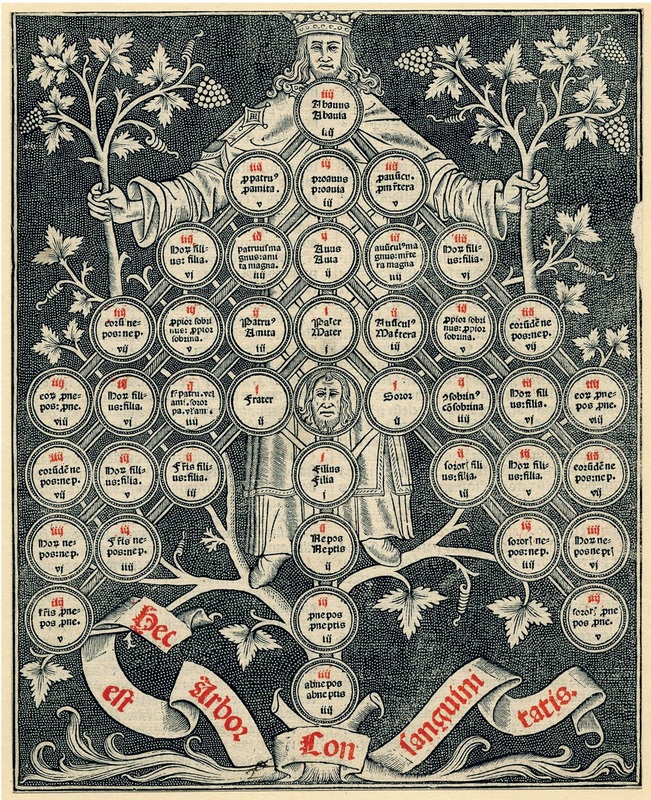
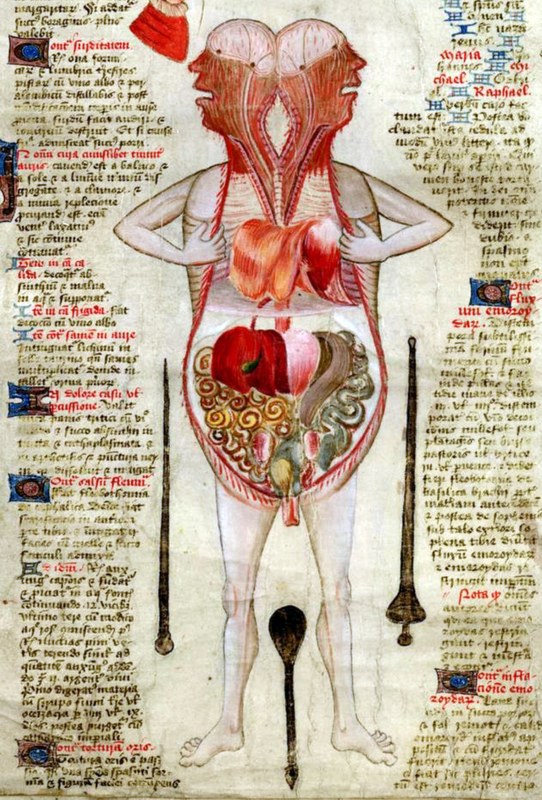
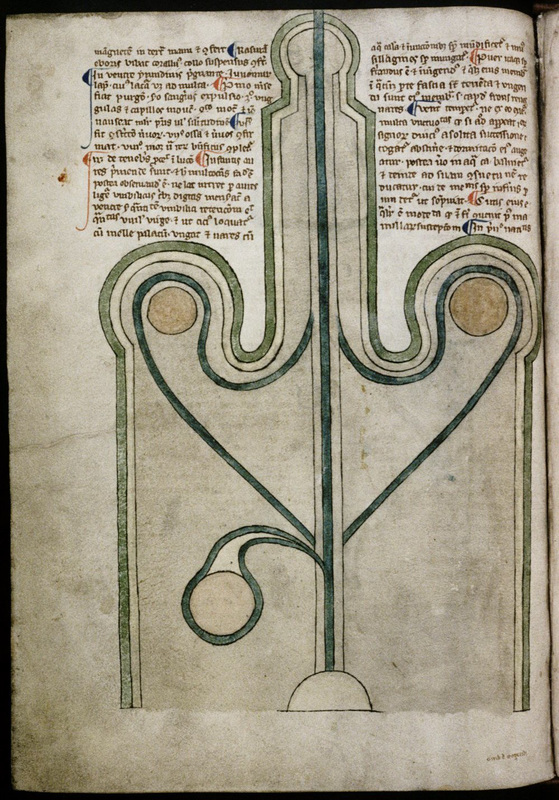
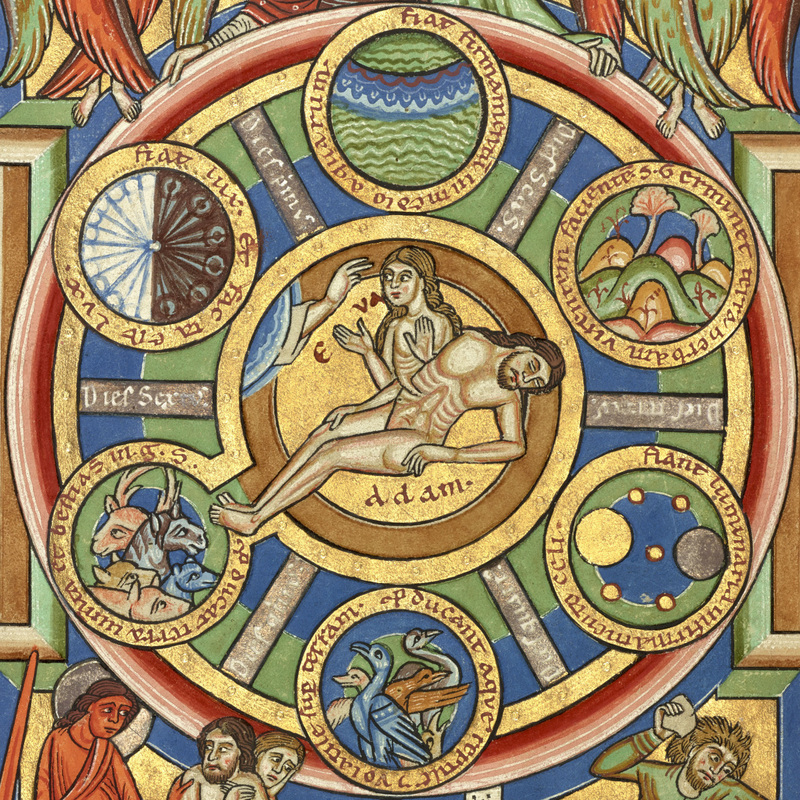
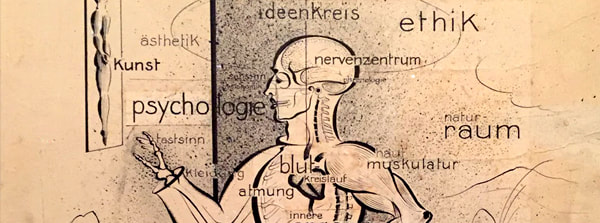
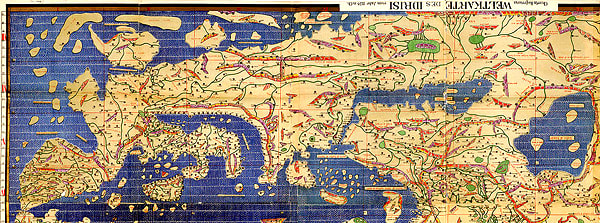
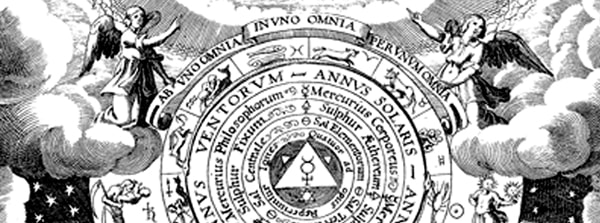
Diagrams played an important role in medieval image making, and it's during this period that fundamental changes took place in how they were used and created. As a result medieval diagrams offer unique insights in to intellectual perception during the Middle Ages. Medieval diagrams combine utility with beauty and practicality with metaphysics. They also adopt aesthetic tendencies towards either visual refinement and clarity or elaborate adornment in an ornate, Gothic, decorative style (see above). The rise of Scholasticism lead to a proliferation of didactic tables and diagrams within monasteries, in order to classify and interpret abstract concepts as stylised, diagrammatic mnemonics. The heuristic power of the diagrammatic format meant that it was used create an array of artistic, philosophical, theological and scientific tools to explore novel ideas and make new connections. On the other hand, the early, esoteric, alchemical diagrams of the period became increasingly hermetic in their interpretation, as their makers employed arcane symbols in chaotic systems of references, and imbued their mystical art with an aura of concealed meaning and noble, archaic secrecy. (See Blog entry: "Cosmic diagrams from the sacred heart of the alchemical laboratory." May 12th, 2016) The ability of diagrams to express several layers of meaning simultaneously rendered them particularly well suited to medieval attempts to anthropomorphically connect time, matter, the cosmos, man and God. Charts of complex, conceptual interrelations were compiled in an attempt to reveal underlying patterns, harmonies and deep connections hidden within nature. Some of the most profoundly creative diagrams from this period come from the hand of a Medieval Italian Monk named Opicinus de Canistris. These incredible works were made on animal skin or 'velum' and the neck of the animal can be clearly made out towards the top of the image below, as Opicinus made good use of this expensive but long lasting material. 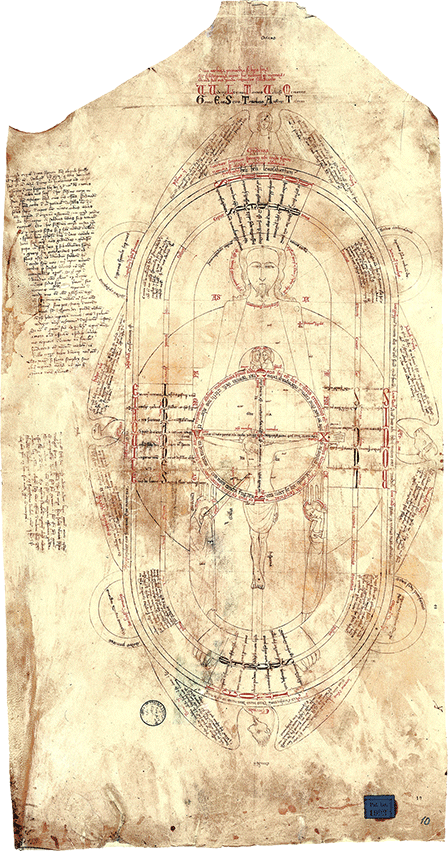 FIgure 3: Opicinus de Canistris (1296–ca. 1354), Diagram with Crucifixion, Avignon, France; 1335–50, Biblioteca Apostolica Vaticana, Vatican City, Pal. Lat. 1993 The accommodating and fluid nature of the diagrammatic format allowed Opicinus to rework figures in a variety of layouts, and search for new ways to arrange the numerous images, beliefs and hypotheses encoded in his works. Maps were overlaid with other maps to create new hybrid schemes of varying transparency and opaqueness. The results are a labyrinthine, diagrammatic logic of Medieval metaphysics - a disorientating mixture of factual accuracy, fanciful creativity and divine revelation that pushes recognition and interpretability to its limits. Karl Whittington proposes that "... Opicinus sought a new value of truth, attempting to find a way to reconcile new science with theological tradition while simultaneously seeing the potential of empirical observation to frame old questions in new ways... his drawings anticipate the concept of man as the measure of all things." (1) These rich diagrammatic art works cleverly mediate between the classic medieval binaries of: human/divine, matter/spirit, visible/invisible, appearance/truth and microcosm/macrocosm. However what sets the cleric’s work apart from other medieval artists of the time is the way in which he combines empirical objectivity with creative subjectivity. This makes the diagrams of Opicinus one of the earliest examples of what I refer to as "Romantically-Objective" diagrammatic art. 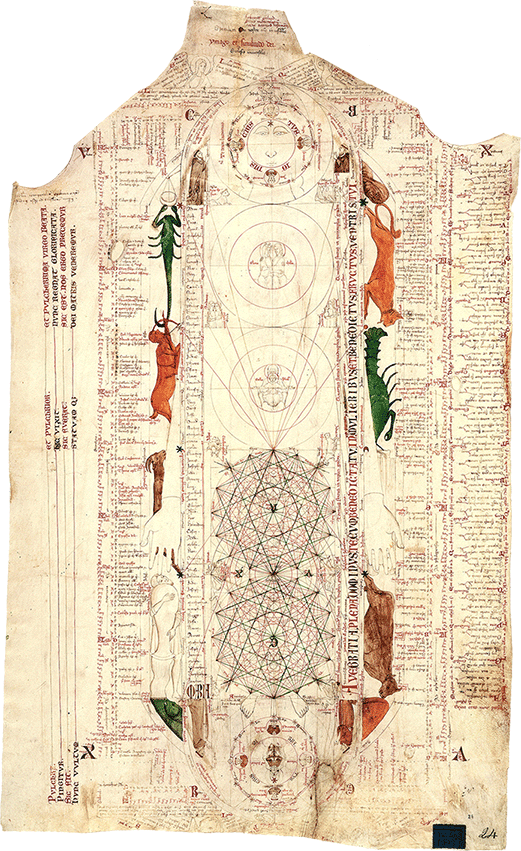 Figure 4: Opicinus de Canistris (1296–ca. 1354) Diagram with Zodiac Symbols, folio 24r Avignon, France, 1335–50 Biblioteca Apostolica Vaticana, Vatican City, Pal. Lat. 1993 Opicinus integrated within his work some of the most technically accomplished cartography of his day in the form of mariners’ sea-charts (portolan charts). This provided an empirical foundation with which to creatively re-structure the more traditional and primarily text based images of the period and, in doing so, create a completely new type of representation. Two circular ‘wind roses’ are positioned above one another, just below the centre of the above figure. Wind rose diagrams are composed of networks of ‘rhumb lines’, a common element in Opicinus’ work and always associated with maps. In this case they contain within them images of Christ, so that their use here suggests his birth, life and death within the mapped out physical space of the earth. (2) The large parchment 'Diagram with Zodiac Symbols' is Opicinus' densest surviving composition, containing over twenty different sets of information: the major prophets, minor prophets, planets, two different sets of zodiac symbols, the doctors of the Church, four monastic orders and their founders, months, days, an implied world map, the genealogy of Mary, the Ave Maria, three personifications of the church, two crucifixions, the gifts of the Holy Spirit, the four types of Biblical exegesis, the four Evangelists, the apostles, and the names of the letters of Paul. (3) There is evidence that Opicinus suffered from stroke like symptoms on the 31st of March 1334, at which time he became paralysed, mute and lost his memory. He also experienced divine visions during which he saw visions of continents and oceans transformed into human figures. Figures 5-7: The divine visions of Opicinus De Canistris, 14th Century These surreal, almost hallucinatory images are amongst Opicinus' most fantastical diagrammatic works, and most depict Europe, as the personification of Christianity, and Africa (Babylon). There are multiple levels of metaphor and meaning within these diagrams, many of which can even be rotated or viewed through a mirror to reveal further storylines and symbols initially hidden from sight upon first viewing. Sexual metaphors are abundant in the biblical language of the Medieval world, and their use corresponds to a high focus on fertility in man and nature within agrarian communities. As in initiation rituals, birth and rebirth play an essential role in religious experience, and "Sexual reproduction became a metaphor for all creation of worlds and beings, both good and evil" (4) Thus we have the image below of Christ depicted as Europe with male genitals between his legs, just off the coast of Venice. Opicinus’ visual statements were closely connected to his own spiritual rebirth, and he identifies with Europe’s circumcised penis naming it Opicinus, minister of the church. In this way Opicinus saw his role and the role of the church as the dissemination of God’s word in the world, spreading the seed of faith so that it may grow among the believers. Opicinus, in "...representing himself as the penis of the Church (...) visualises the idea that all clerics wore the marks of Christ’s circumcision (and thus sacrifice) on their heads." (5) This explicit free play with concepts of sex and self is very unusual in a medieval context and make Opicinus ‘s work a unique piece of medieval heritage. (It should be noted that the image below is the reverse of the original, which was drawn in mirror image so that the text was illegible.) 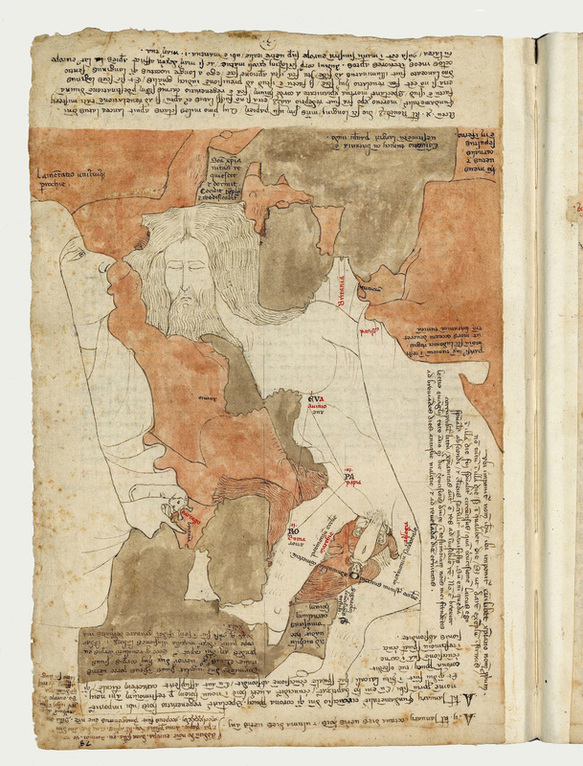 Figure 8: Opicinus De Canistric, The seed of faith, c. 1330. Below is a gallery of various Medieval diagrams that embody the creative range of their use during this period. From blood letting to early anatomical compendiums and surgical procedures, diagrams were also used to predict the dates of religious events, solstices and equinoxes, as well as map regions of coast, the world and even the cosmos. Yet other diagrams show genetic lineage depicted as extended family trees whilst others provide visual overviews to stories in the new testament. Their range of creation and use show how diagrams have played a fundamental role in shaping the way humans think about the world and how we creatively work with novel ideas. ( many of the images are in high resolution, click on images for larger views and captions ) 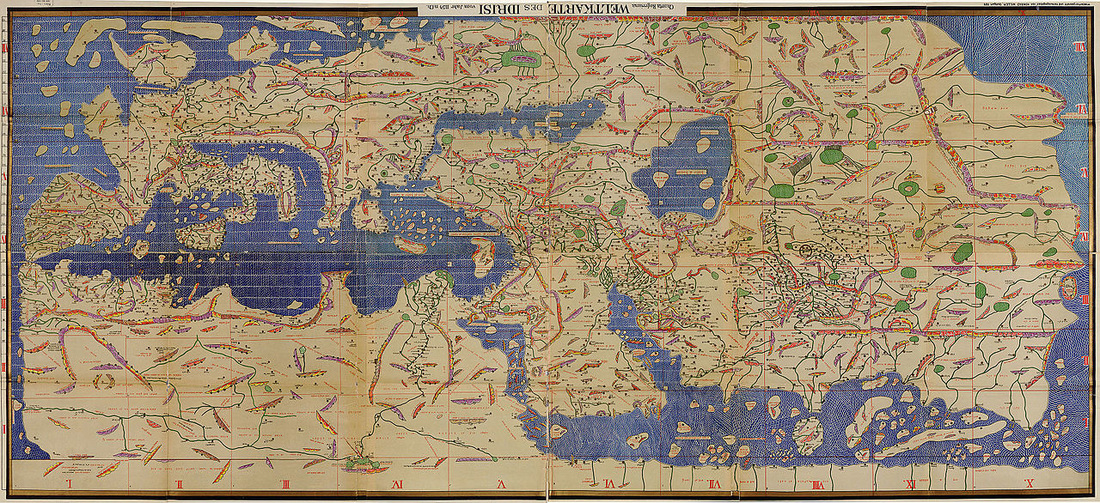 Figure 9: The Tabula Rogeriana (shown here upside down), drawn by Al-Idrisi for Roger II of Sicily in 1154, one of the most advanced ancient world maps. Modern consolidation, created from the 70 double-page spreads of the original atlas. References:
1) Whittington, K.P. (2009) Opicinus de Canistris, Vatican Library Pal. Lat. folios2v, 20r, 24r. In: Holcomb, M. and Bessette, L. (Eds) Pen and parchment: drawing in the middle ages. The Metropolitan Museum of Art (2009, Yale University Press), p.148-55. 2) Ibid. 3) Holcomb, M. and Bessette, L. (2009) Pen and Parchment: Drawing in the Middle Ages. New York: Metropolitan Museum of Art, (2009, Yale University Press), p.154 4) Whittington K.P. The Body-Worlds of Opicinus de Canistris, Artist and Visionary (1296-ca. 1354), PhD Berkely, 2010, p. 106. 5) Ibid, p. 110. |
Dr. Michael WhittleBritish artist and Posts:
Categories
All
Archives
April 2024
|