|
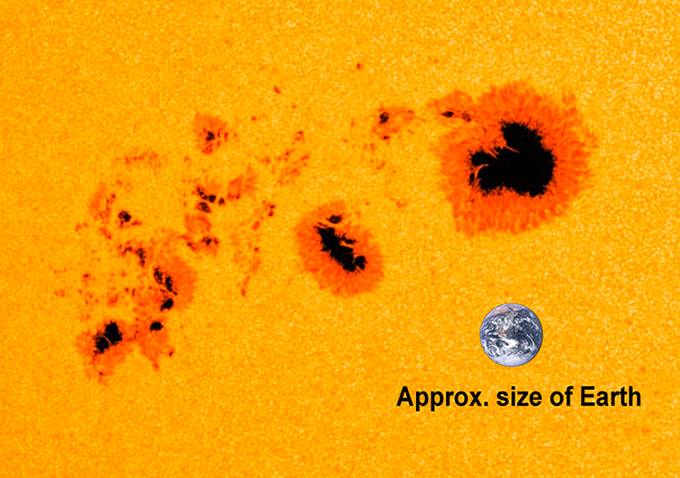
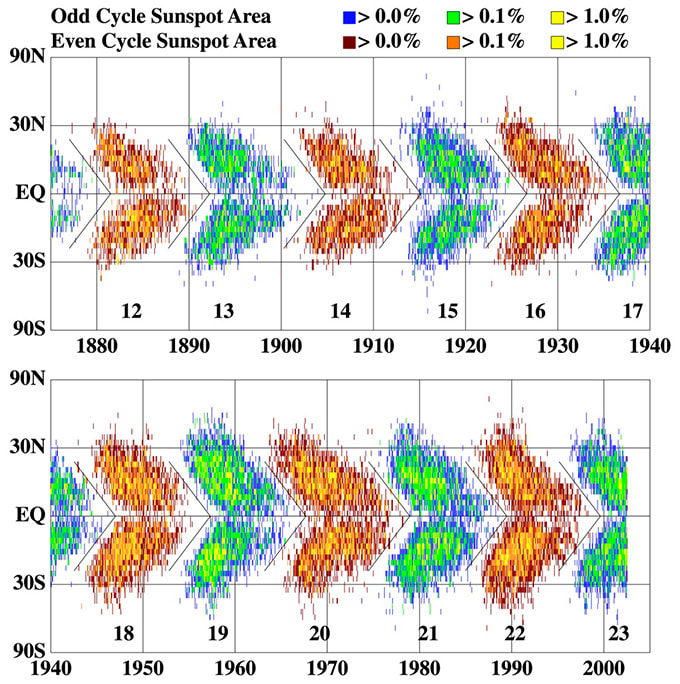
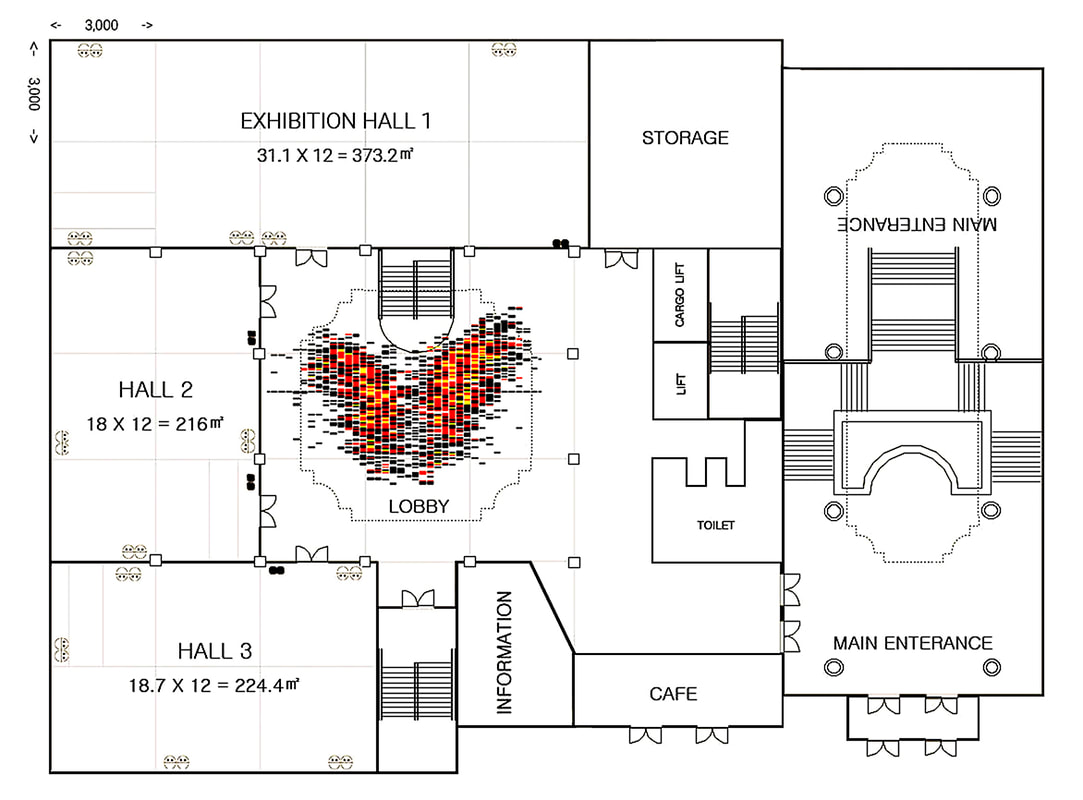
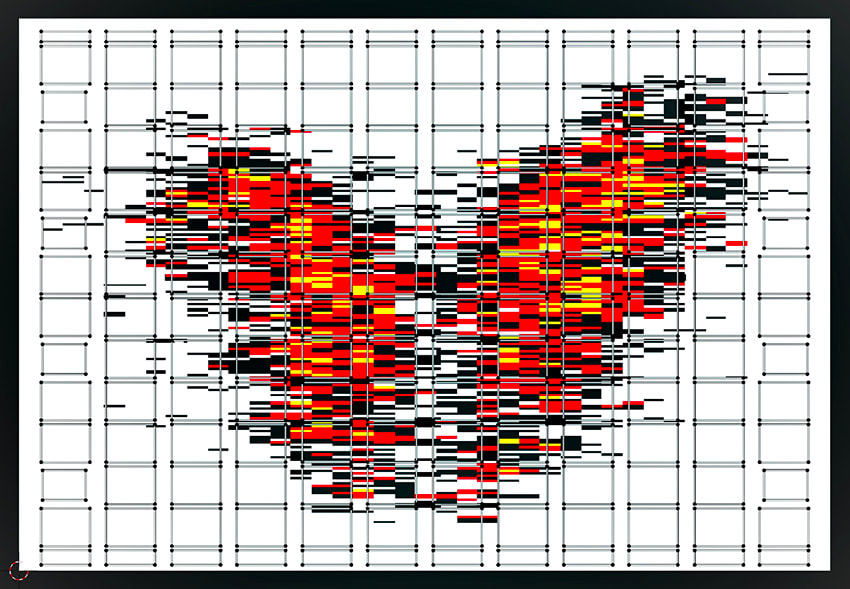
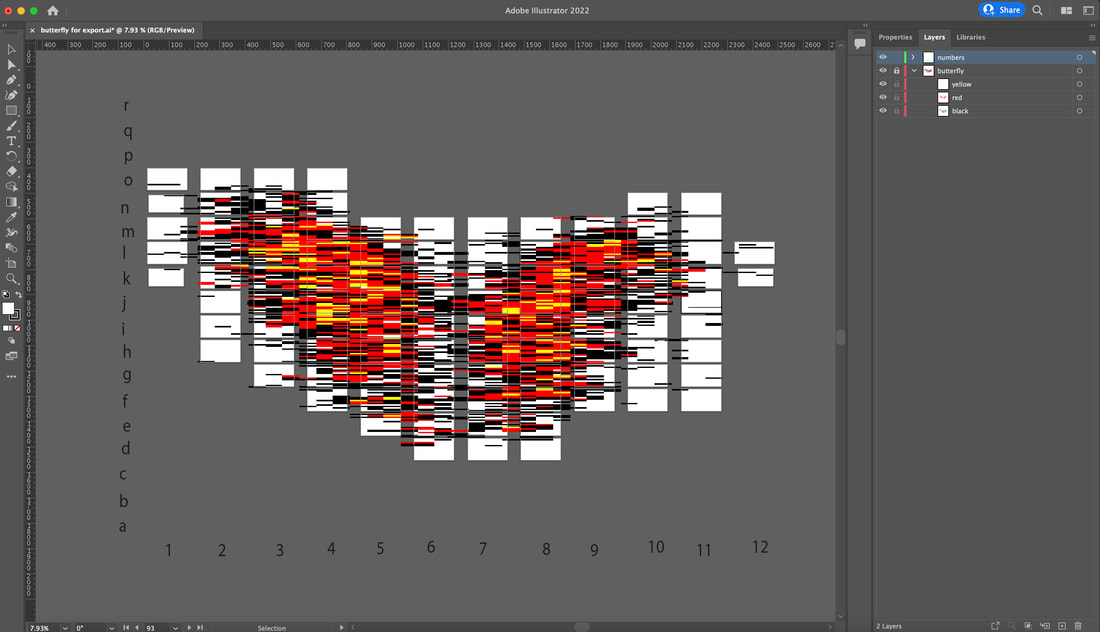
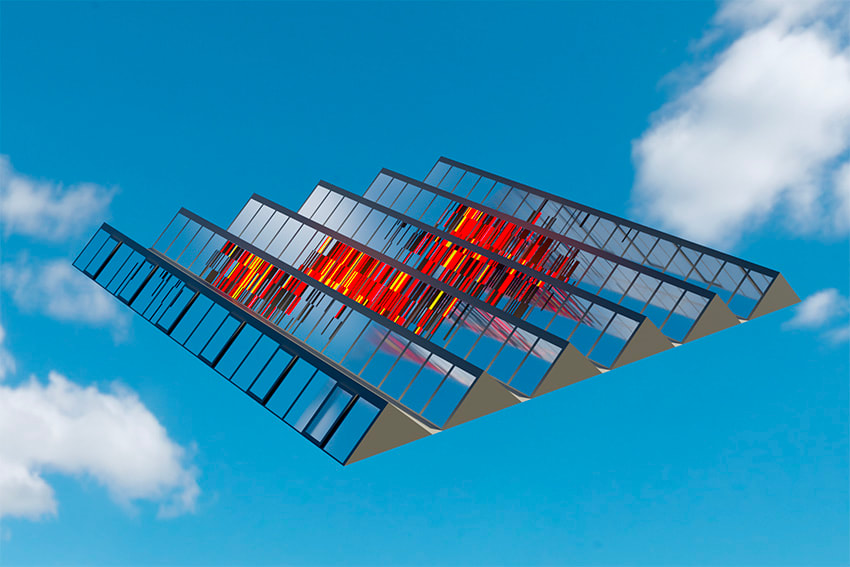
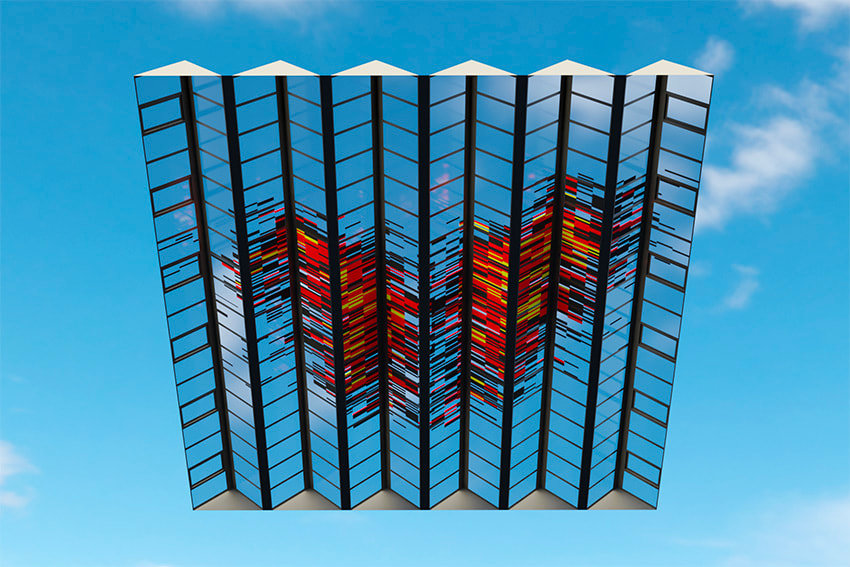
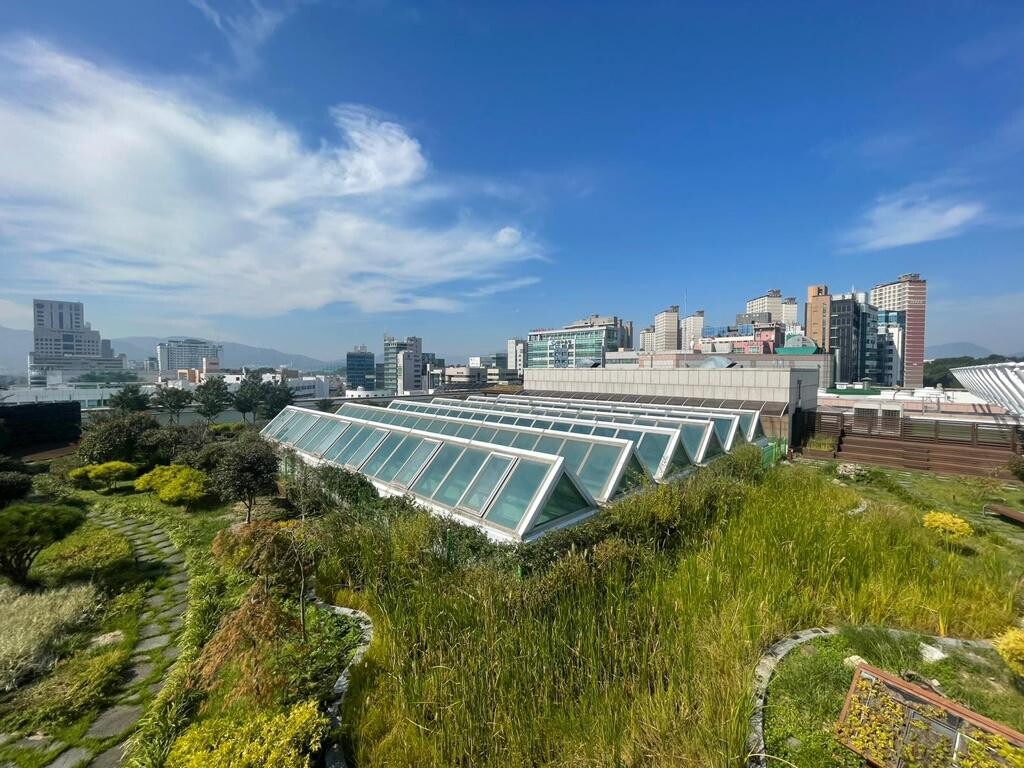
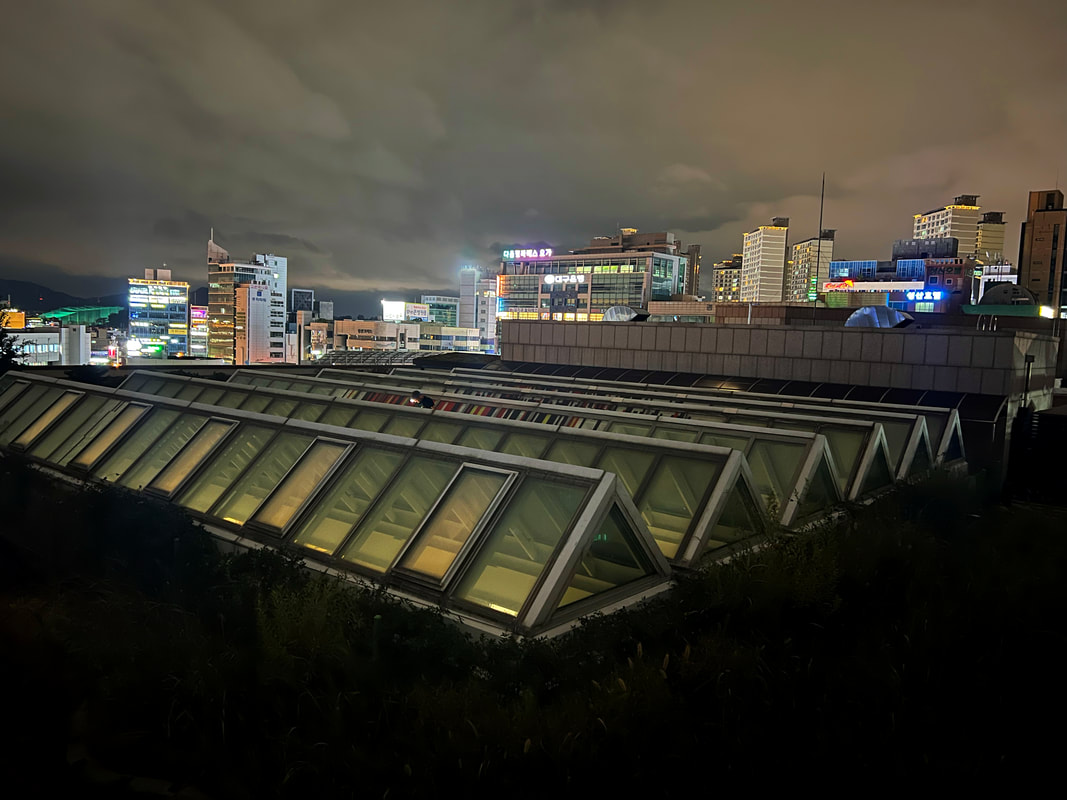
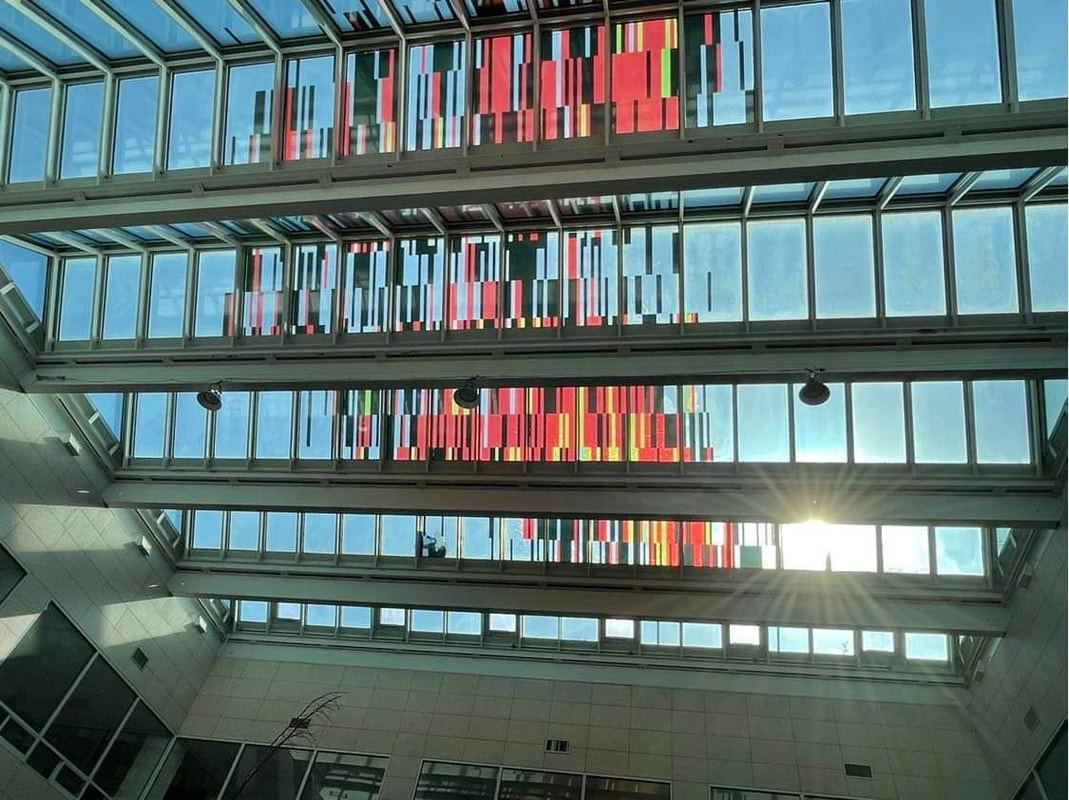
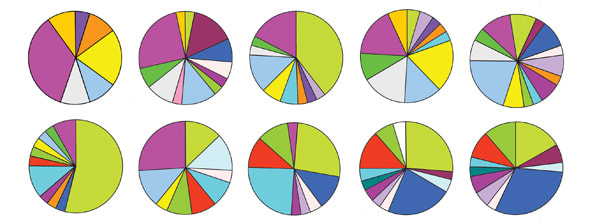
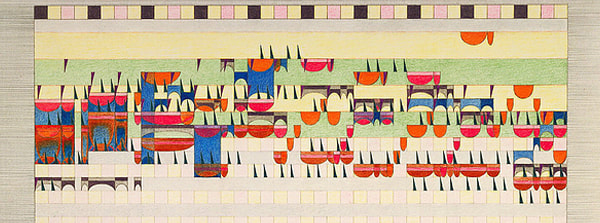
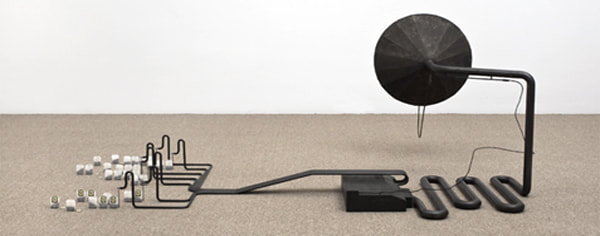
❉ Blog post 24 on diagrams in art and science looks at one of my favourite diagrams from Astrophysics, the Maunder or Butterfly diagram. Names after the brilliant husband and wife astronomers Edward and Annie Maunder, these technical plots of Sunspot position and size continue to reveal valuable insights in to the activity of the Sun, and allow us to explore and predict the cyclical effects that solar activity has on life on Earth. Figure 1: Video footage of granules surrounding a sunspot Credit: Swedish 1-m Solar Telescope (SST) 2004 For millennia, enigmatic dark spots on the surface of the Sun have captivated observers, with the first recorded sightings dating back to ancient China, circa 800 BC. However it wasn't until the early 17th century that the invention of the telescope allowed for a more systematic and scientific study of these phenomena, allowing early scientists such as Galileo Galilei to embarked on the meticulous documentation of these spots, pioneering a tradition of consistent observation that underpins modern solar research. Sunspots are dark regions that appear on the sun's photosphere, which is the outermost layer visible to us. They appear darker because they are cooler than their surroundings, with temperatures ranging from 3,800 to 4,300 Kelvin. This is a significant difference compared to the Sun's average surface temperature of around 5,800 Kelvin. The formation of sunspots has been linked to the Sun's magnetic field, which arrises from the movement of electrically charged plasma inside the Sun known as the solar dynamo. These vast, powerful magnetic fields can become twisted and tangled due to the way in which the Sun spins faster at its equator than at its poles. This difference in rotational speed is also responsible for the distinctive shape of butterfly diagrams, as we'll later see. 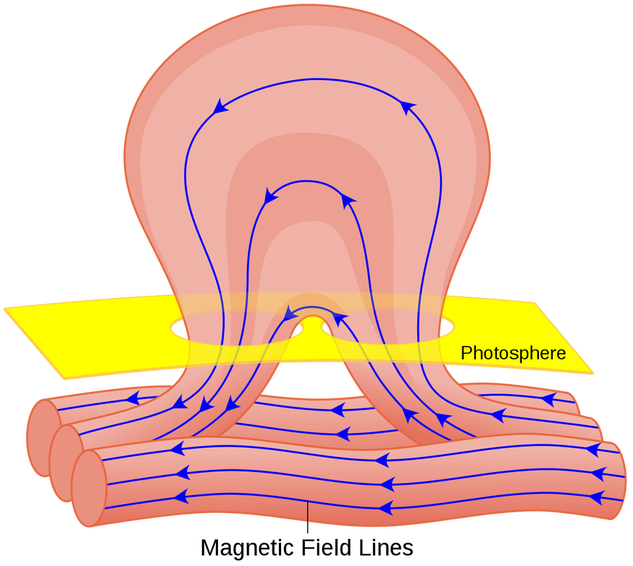 Figure 3: Diagram of the magnetic line structure of a solar flare and its origin caused by deformation of the magnetic field lines in the sun. Image courtesy of wikimedia commons Sunspots typically occur in pairs called bipolar sunspot groups, with each spot having an opposite magnetic polarity. The magnetic field lines form loops, extending from one spot to the other. The intense strength of these magnetic fields can hinder convection, the process by which hot plasma rises to the Sun's surface, cools, and then sinks back down. This hindrance in plasma flow results in a relative decrease in temperature. The stronger the magnetic field, the greater the temperature reduction, and consequently, the darker the sunspot appears. 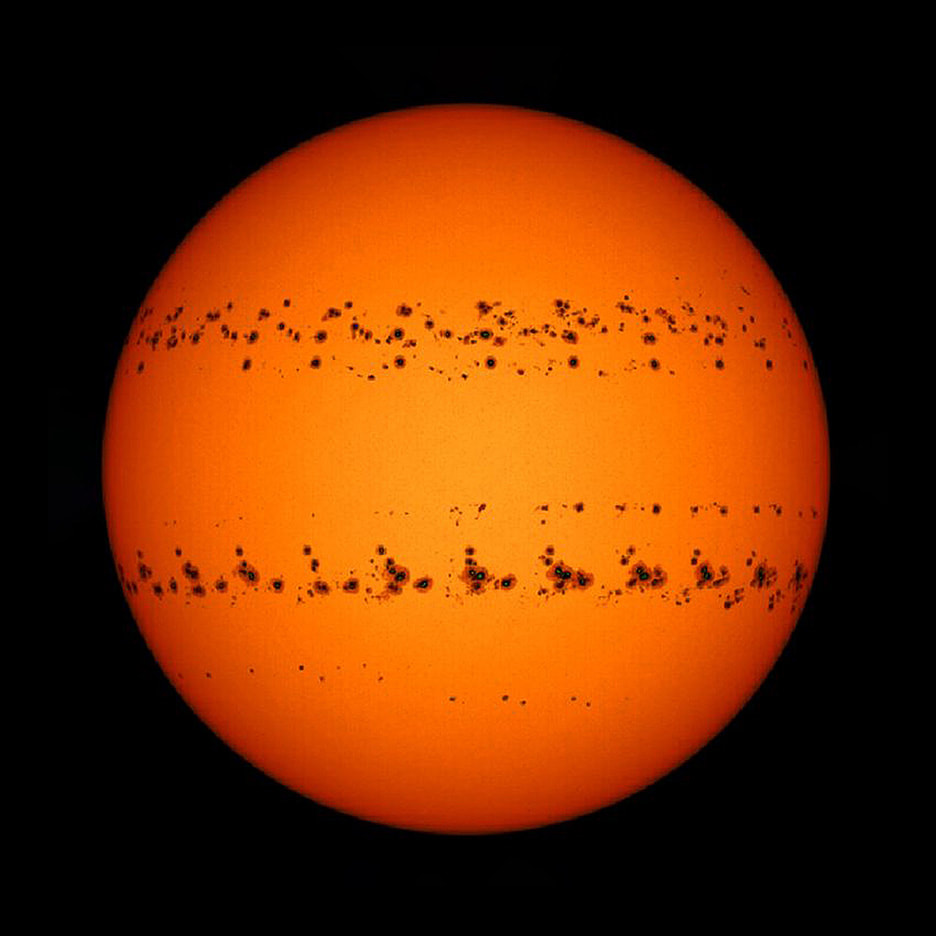 Figure 4: A time-lapse image of all the sunspots that appeared on the sun in June 2023. (Made using data from NASA's Solar Dynamics Observatory.) (Image credit: Şenol Şanlı) The number and location of sunspots on the Sun's photosphere follow a solar cycle that lasts approximately 11 years. During the solar maximum, the period of highest activity, sunspots are abundant and mainly found in mid-latitudes. As the cycle progresses towards the solar minimum, a calmer phase, sunspots become scarcer and are located closer to the Sun's equator. Solar cycle 1, which lasted from February 1755 to June 1766, was the first solar cycle to be extensively recorded. Johann Rudolph Wolf, who discovered this cycle, determined its duration to be 11.3 years. Wolf was inspired by Heinrich Schwabe's 1843 discovery of the solar cycle and collected all available sunspot observations, dating back to Galileo's first telescopic observations. Through his research, Wolf refined Schwabe's estimate of the average cycle length from about 10 years to 11.11 years. However, due to a lack of reliable observations before 1755, Wolf could not confidently identify earlier cycles. As a result, the 1755–1766 cycle is conventionally designated as cycle 1. Wolf's groundbreaking findings, which he published in 1852, laid the groundwork for our current understanding of solar cycles. 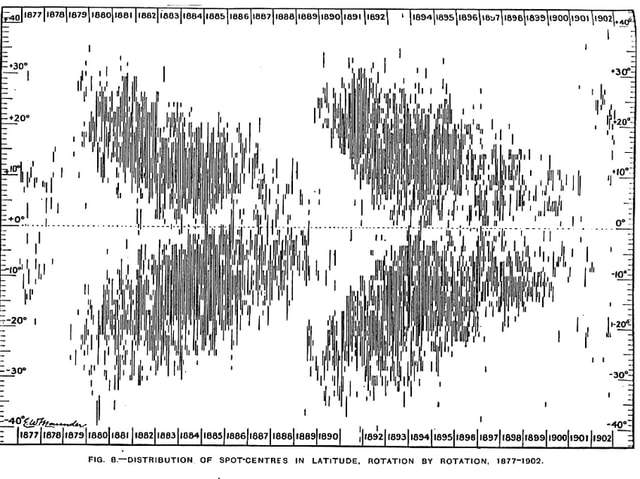 Figure 5: Butterfly diagram published by Edward and Annie Maunder (1904) illustrating the movement of active solar latitudes toward the equator as a solar cycle progresses. British astronomer Edward Maunder (1851–1928) developed a strong fascination with astronomy, particularly solar astronomy, from a young age. His interest was ignited by his observation of a large group of sunspots visible to the naked eye in February 1866. In 1881, Maunder became the head of the solar program at the Greenwich Royal Observatory in London, where he collaborated with his second wife and fellow astronomer Annie Maunder (1868-1947). Edward's new role allowed him to focus on his own research and investigate potential links between sunspots, solar activity, geomagnetic activity, and the Earth's environment. However, he faced persistent skepticism from the scientific community, including prominent figures like Lord Kelvin (1). Figure 5 displays the first Maunder diagram, published by Edward and Annie in 1904 and gifted by Annie to the renowned astronomer Walter Orr Roberts, the first director of the High Altitude Observatory in Boulder, Colorado. The diagram illustrates the distribution of sunspots recorded between 1876 and 1902 (north above, south below). These elegant plots resemble butterfly wings and quickly gained the nickname "Butterfly Diagrams." The original Maunder butterflies are also included in Prof. David Hathaway's comprehensive and updated sunspot chart, created during his 30-year tenure at NASA using 140 years of data (Figure 6). Prof. Hathaway is a leading expert on sunspots and former head of Solar Physics at NASA's Marshall Space Flight Center, and more details of his research can be found at Solar Cycle Science. I reached out to Prof. Hathaway, who kindly endorsed my proposal to adapt his work into a sunspot project at the 2022 Changwon Sculpture Biennale in South Korea. The Butterfly I chose for the installation occurred during Solar Cycle 20, between November 1964 and July 1980, the period in which I was born in July 1976. 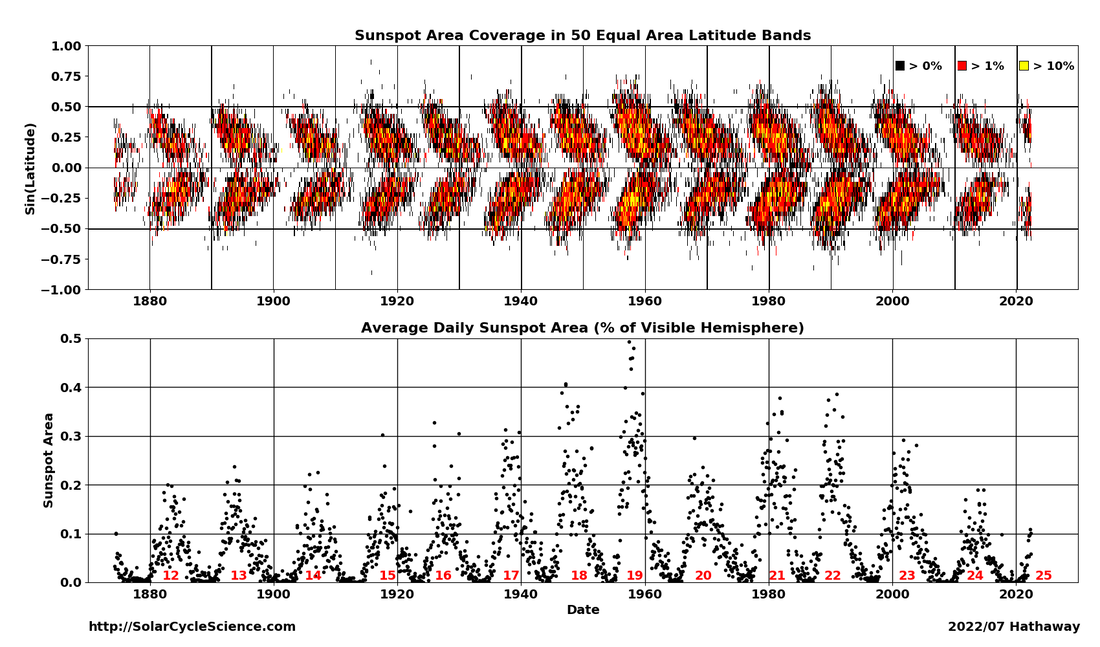 Figure 6: Sunspot area butterfly diagram showing the distribution of sunspot area as a function of latitude since 1874. (from SolarCycleScience.com, D. Hathaway) The Changwon Biennale is South Korea's largest recurring sculpture show, and during the fall of 2022 it showcased 69 artists under the title, 'Channel: Particle Wave Duality'. Curated by Director Cho Kwan Yong, Chief Curator Lee Tahe Hoon and Curator Hyojin Nam, the show considered the broad sense of how light and matter interact at the intersection of art and science. In preparation for the Biennale, the curatorial team sent out plans and photographs of each of the exhibition galleries, including the main atrium of the Seongsan Art Hall with it's enormous glass ceiling. I'd recently worked on a window installation for a project to design a city on Mars based on the structure of the Ribosome molecule, and asked the Biennale team to measure the 216 panes of glass in the ceiling in order to design the sunspot butterfly installation. 3D artist and illustrator Tony Cheng then used those measurements to create a computer model of the ceiling so we could experiment with different sized butterflies and predict how the installation would look when viewed from different angles and floors within the building below. 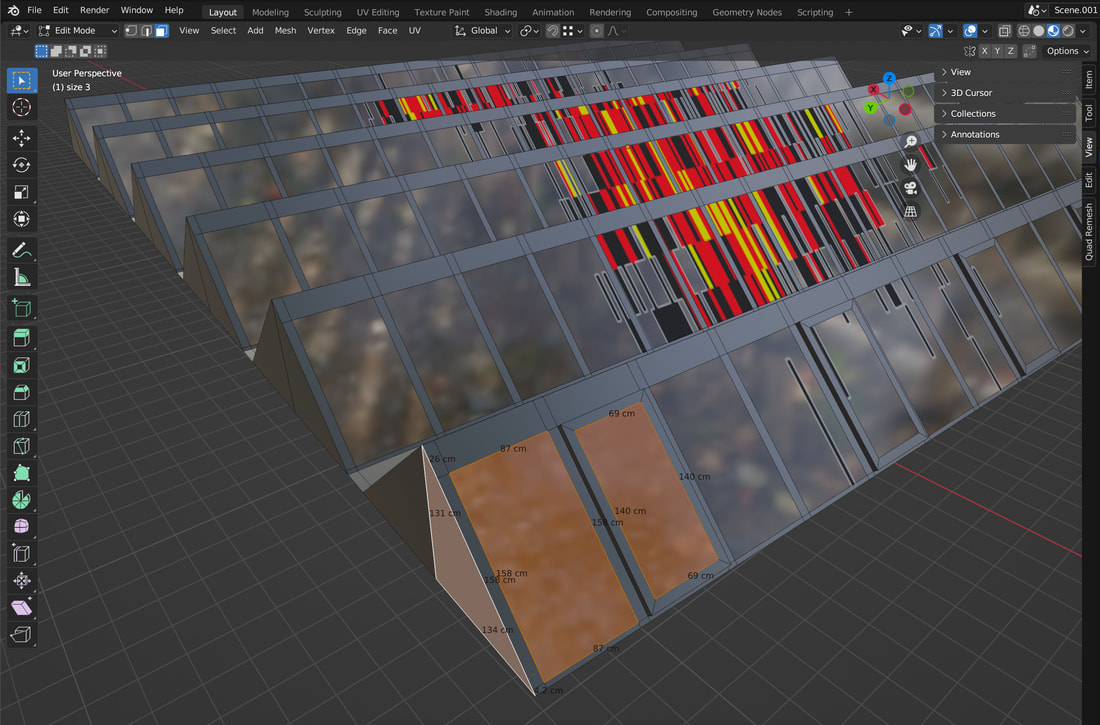 Figure 7: 3D Blender model of the glass ceiling at Seongsan Art Hall, Gwangju |
Dr. Michael WhittleBritish artist and Posts:


Categories
All
Archives
April 2024
|