|
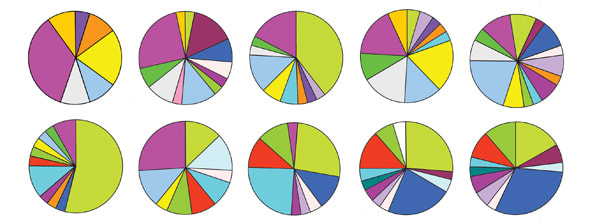
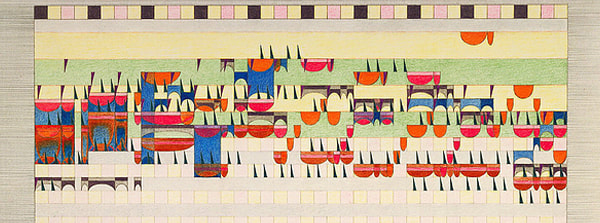
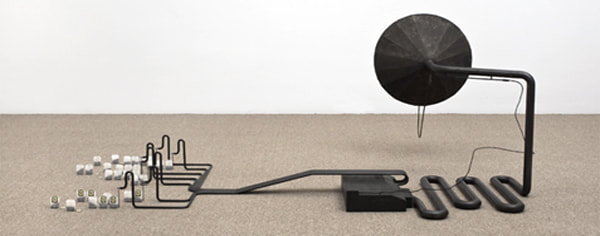
❉ Blog number 19 on diagrams in art and culture covers a recently completed installation for the Yi Tai Sculpture and Installation projects curated by Andre Chan for Hong Kong's 2021 Art Central. Figure 1: Perpetual Motion (installation view), 2021, Yi Tai Projects, Hong Kong Art Central Mapping Movement Perpetual Motion was created for Yi Tai Sculpture & Installation Projects, curated by Andre Chan for Art Central Hong Kong in 2021 (Figure 1). The initial ideas for the project were sketched out in the midst of the global Covid-19 pandemic, during mandatory quarantine in a hotel room in Hong Kong, in January of 2021. I had flown in from Osaka on an empty evening flight and transferred by shuttle bus to my hotel. Once signed in I was guided along corridors lined with security cameras to a room with bay windows overlooking the city. I unpacked and tried to mentally prepare myself for the next 21 days confined to a 24 square metre space (258 ft² ). The subjects I chose to focus on for the installation were movement and location, which seemed timely during a period of worldwide travel restrictions, lengthy quarantines and social distancing. In a previous project I'd explored the molecular and evolutionary origins of organic movement, and this involved studying Actin and Myosin, two types of specialised motor-proteins found in all types of muscle cells. International research groups had mapped out the structural relationships amongst these two ancient super-families of molecules, and I used their findings to build my own 3D computer models of these molecular family trees, which were then used to create a drawing. 'Model for the origins of movement' depicts the branching, diagrammatic lineages of actin and myosin as fragile interlinked tori floating in an empty white space (figure 2). 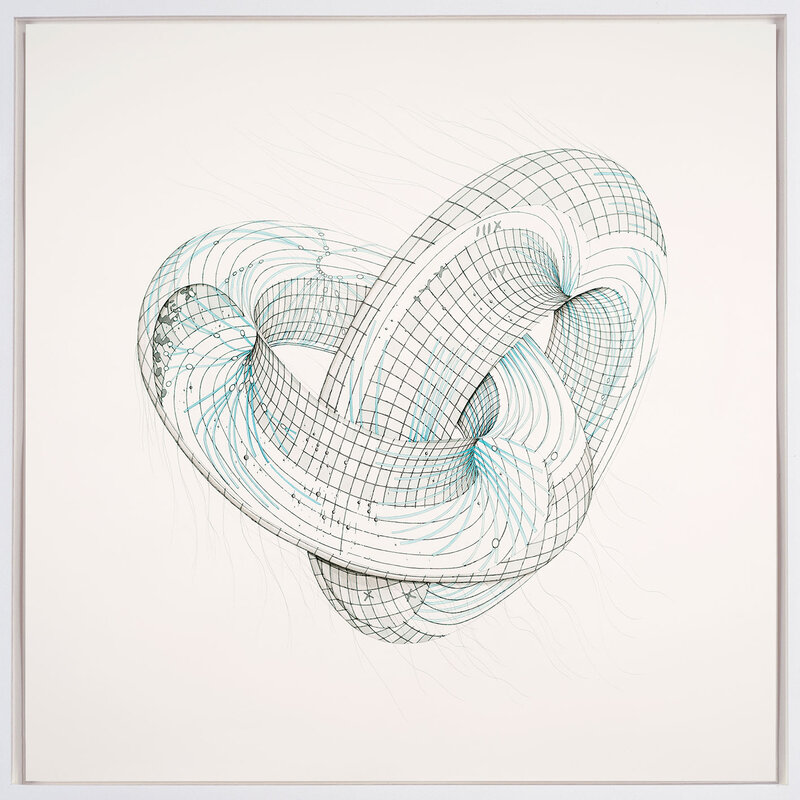 Figure 2: Model for the origins of movement (Myosin and Actin molecular family trees as linked, punctured tori) 2017, 124 x 124 cm, Ink and watercolour on paper The process of creating this work is described in greater detail in the article "Portraits of thought: Transfiguring the diagrams of science", written for Intellect Book's "Drawing: research, theory, practice" (1). A link to the Journal is here. Links to the original research papers on Actin and Myosin can be found in the references below (2,3) Like 'Model for the Origins of Movement', the installation 'Perpetual Motion' incorporates concepts and theories from scientific studies of movement, but also location, and it sets in contrast the different ways these notions are being explored in contemporary science. The first research project to catch my attention was a visual digest of cutting edge genetic studies that plot historical global patterns in human genetic variation. The resulting world-maps provide a snap-shot of our current understanding of genetic similarities and differences between male and female population groups, and also reveal the routes taken by our prehistoric ancestors on their journey out of Africa. Another discovery I was immediately drawn had proven to be such a major breakthrough in the neuroscience of movement that it was awarded a joint Nobel prize in 2014. The discovery of 'Grid cells' and their distinctive geometric firing patterns by Britt and Edvard Moser built upon the work of their mentor John O'Keefe, the discoverer of 'Place Cells'. Together, these studies gave us our first glimpse at the intricate cellular mechanisms at work in the brain that underlie how we navigate space, and revealed profound connections between location and the formation of memories. As an installation ‘Perpetual motion’ is a hodological study (the study of pathways) of our past global movements across deep time, and our more intimate passages and navigations through daily life. The project contrasts the vast networks of our ancestor’s migration patterns out of Africa, against our day-to-day meanderings through rooms, buildings and cities. Out of AfricaCurrent estimates date the origins of anatomically and genetically modern humans in Africa to between 150,000 and 200,000 years ago, and the first major dispersal of these populations to Asia and Europe is believed to have occurred around 65,000 years before present (B.P.) (4). (Figure 3) DNA haplogroup maps help trace patriarchal and matriarchal human lineages back across time, in order to understand how populations have spread across the globe. Haplogroup maps rely upon measuring distinctive mutations within genetic elements of the genome that vary little over time. In males such material is found within the non-recombining portions of DNA in the Y-chromosome. For females similar material is found within Mitochondria, energy providing microscopic structures within human cells that contain their own plasmid-like DNA structures. Mitochondrial DNA (MtDNA) comprises only a small segment of the total human genome but has proven highly effective in studying early human populations. MtDNA has the advantage of unusually rapid mutation rates, descends almost entirely through the female lineage (via the female ovum / egg), and shows few, if any, of the effects from environmental selective forces. 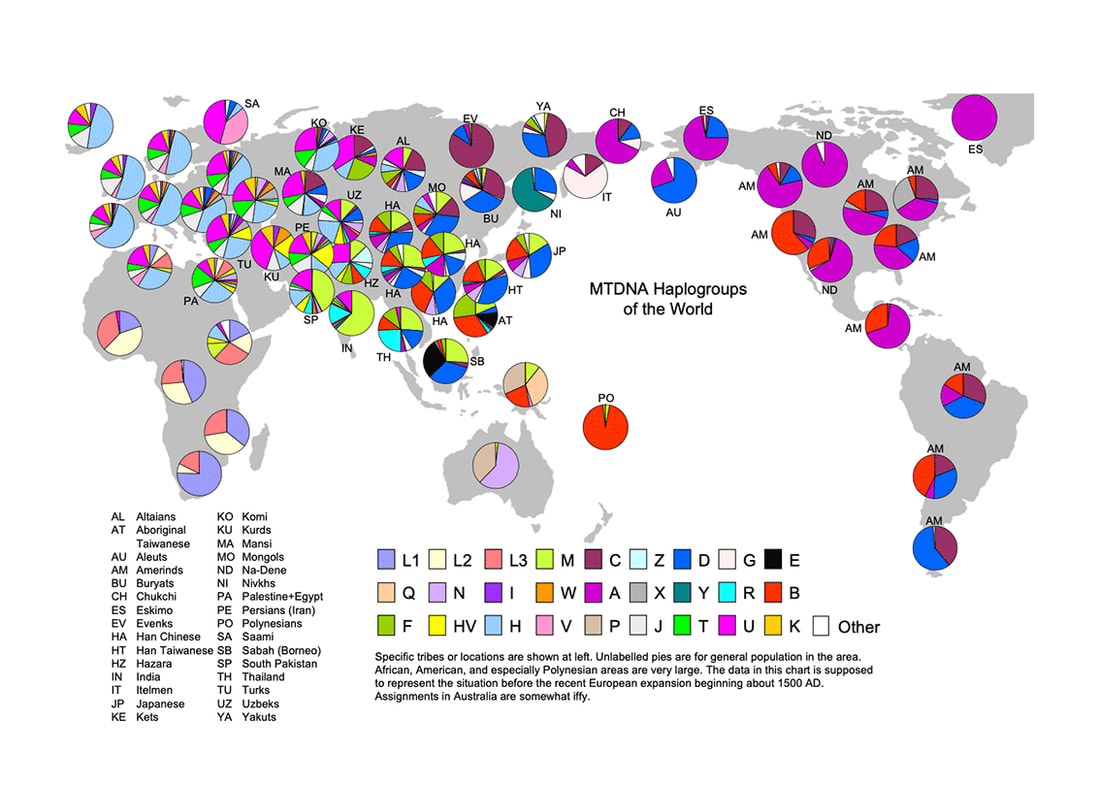 Figure 3: Mitochondrial DNA Haplogroups of the World, circa 1500 AD, Copyright © 2005 J. D. McDonald The coloured pie charts in figure 3 represent world-wide genetic variation within female populations. The period of time chosen for the map is circa 1500 AD, just before what's referred to as the 'European expansion', marked by rise of colonial empires and vast commercial networks. Professor J.D. McDonald, who compiled the chart from a number of location specific studies, noted in his paper that the sampling sizes and thus the accuracy of the chart varies greatly from region to region. In fact, the majority of genetic data is derived from Europe and North America, despite Africa being the most genetically diverse continent on the entire planet (5). I reached out to Prof. McDonald to explain the nature of my project and ask permission to adapt the diagrams from his research into an artwork, which he kindly granted. For ‘Perpetual Motion’, the 28 colour variations that represent the common MtDNA haplogroups used to compile Prof. McDonald’s map, were meant to be translated in to coloured glass, with each pie chart segment cut using a robotic CNC water-jet machine. The glass segments were then to be reassembled using traditional stained-glass techniques and suspended as a map-like mobile within the exhibition space. However, with estimated visitor numbers of 20,000 people over the 4 days exhibition, the decision was made to UV-print the disks on acrylic due to health and safety requirements. Each circular diagram was then wrapped in the lead ‘came’ for this version of the sculpture. The GPS System of the Brain For 'Perpetual Motion', each coloured pie chart was suspended using black monofilaments in its appropriate position, according to the original map, and left spinning beneath a double-ended, hollow, black, branching structure (figures 4a,4b). Beneath the mobile was positioned another diagrammatic artwork mapping movement and location at very different scales of time and space.
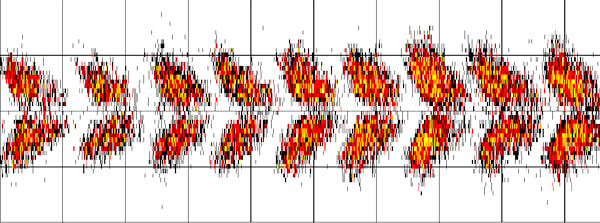
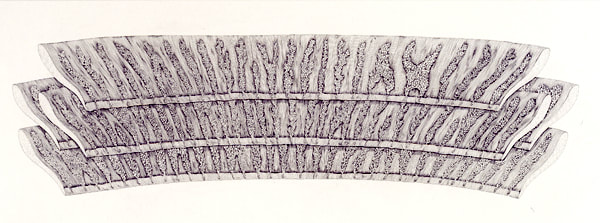
The carpet sculpture is designed to be walked upon, and the pattern is derived from 'Grid cells' in the mammalian brain. The discovery of Grid cells and their distinctive geometric firing patterns by May Britt and Edvard Moser built upon the work of their mentor John O'Keefe, the discoverer of 'Place Cells'. Together, these findings revealed profound connections between the way we navigate space and construct memories of our surroundings. Grid cells are a specialized type of neuron that constitute a self-positioning system within the brain allowing us to create cognitive spatial maps of the spaces we explore and inhabit. These cells are found within the mammalian entorhinal cortex, a region deep within the brain next to the hippocampus. They derive their name from their triangular grid-like firing patterns, and the phenomenon was first recorded in the brains of mice exploring an experimental test box over a period of time (6) (figure 5). Figure 5: A video of a single grid cell recorded in the Medial Entorhinal Cortex. A dot is added at the position of the rat every time the cell spikes. Slowly the dots accumulate and the hexagonal grid-pattern emerges. At the start of the project I contacted Professors May Britt and Edvard Moser who granted permission for me to adapt images from the research for this installation. Dr. Elmkvist-Nilsen, head of communication at the Kavli Institute for Systems Neuroscience, also kindly sent me copies of the Moser’s research papers, images and presentations. Dr. Elmkvist-Nilsen is a specialist in images of 'knowledge-visuals' generated in scientific research, and has a dual background in visual arts and human/zoo biology. Interestingly, Nobel Media now owns the rights to the Moser’s original illustrations of grid cells in rodents and humans, and their research group must now produce their own versions before sharing for public use. As a result, I decided to recreate my own diagram of the Moser’s iconic grid-cell firing patterns, which was then used to produce a handmade woolen 3.5 square metre carpet beneath the mobile haplogroup sculpture. 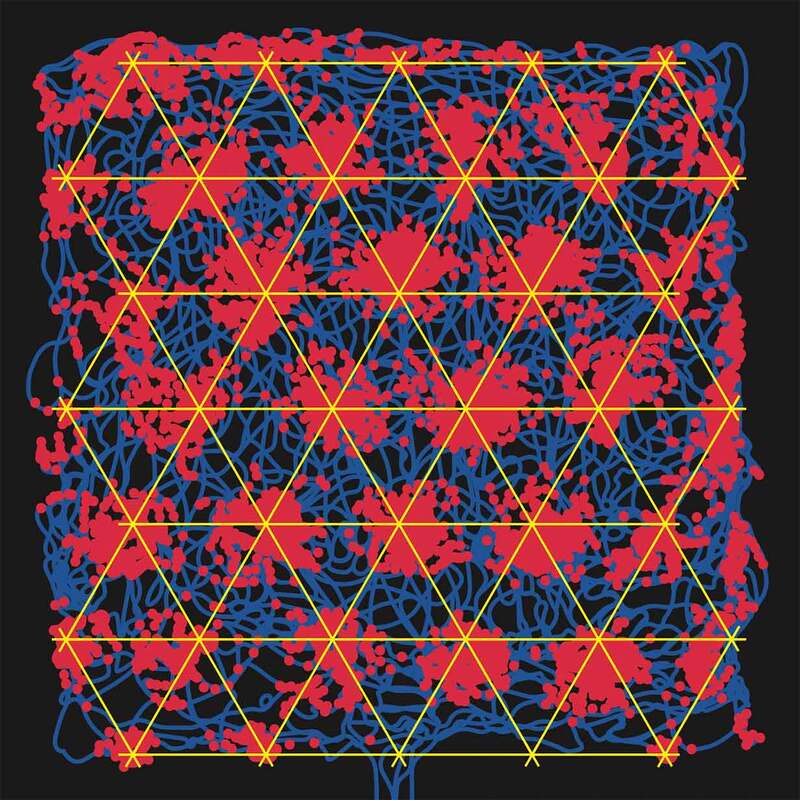 Figure 6: Artist’s recreation of grid-cell firing patters used to create the custom carpet. Figure 6 shows my recreation of grid-cell firing patters. The blue line represents the path taken by the mouse in search of chocolate drops inside the test chamber, and each red point marks the firing of the single grid cell being measured during the experiment (figure 5,6). The yellow lines highlight the remarkably geometric triangular firing patterns observed within this region of the brain. As visitors navigated and explored the space, the symbolic markings on the carpet mirrored microscopic neuronal processes occurring within their brains, whilst above them circulated a mobile constellation of pie charts containing genetic data from their historic female ancestors. I would like to thank Professor J.D. McDonald, Professors May Britt and Edvard Moser and Dr Elmkvist-Nilsen for their enthusiastic support of this project, and for their generous permission to use their research and images to create this installation. References:
1) Whittle, M. (2020), “Portraits of Thought: Transfiguring the diagrams of science”, Drawing Research Theory Practice, volume 5, number 2. pages 311-317 2) Goodson, H. V. and Hawse, W. F. (2002), ‘Molecular evolution of the actin family’, Journal of Cell 21. Science, 115:13, pp. 2619–22. Online here 3) Hodge, T. and Cope, J. (2000), ‘A myosin family tree’, Journal of Cell Science, 113:19, pages 3353–54. Online here 4) Why did modern human populations disperse from ca. 60,000 years ago? A new model 10325 9381 - 9386Online: https://doi.org/10.1073/pnas.0510792103 5) Choudhury, A., Aron, S., Botigué, L.R. et al. High-depth African genomes inform human migration and health. Nature 586, 741–748 (2020). https://doi.org/10.1038/s41586-020-2859-7 6) Moser, E., Roudi, Y., Witter, M. et al. (2014). Grid cells and cortical representation. National Review of Neuroscience, 15, pages: 466 - 481 Online: https://doi.org/10.1038/nrn3766
0 Comments
❉ Blog number 17 on diagrams in art and culture covers some of the ideas, images and research projects I discovered during a spring-time residency on the island of Jeju in South Korea. The two new drawings I developed following my stay there were on show in a group exhibition at the Chusa Memorial Museum from Oct 15th - Nov 17th, 2019. 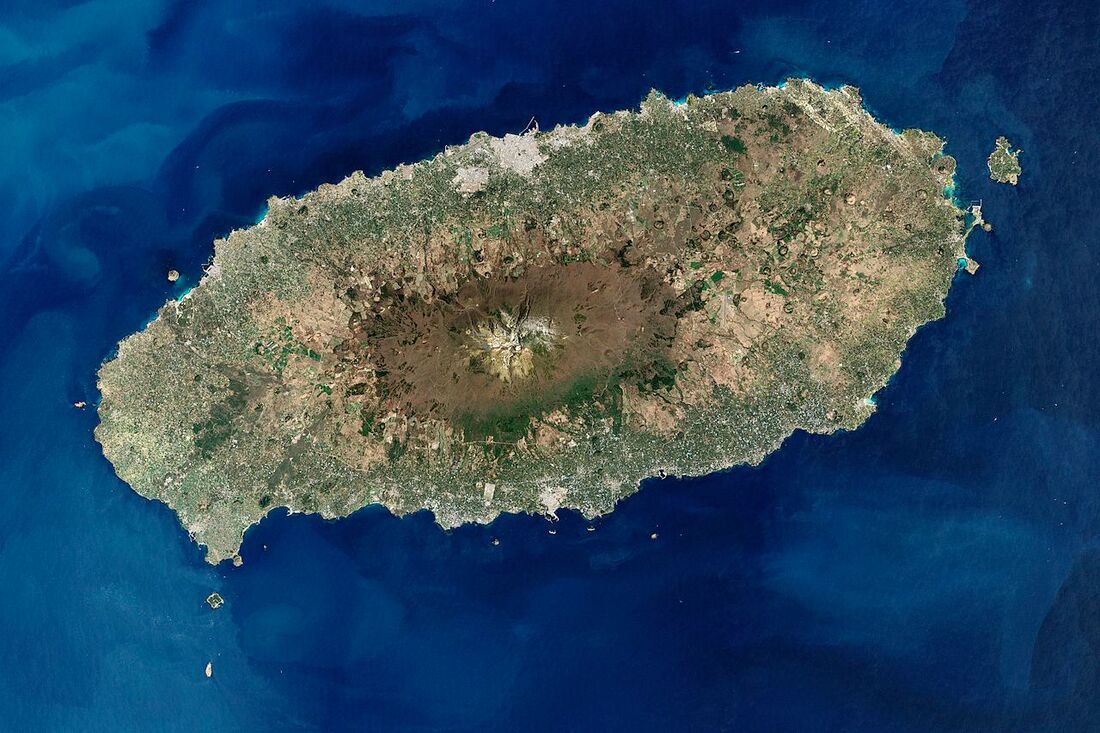
figure 1: NASA image of Jeju Island
( United States Geological Survey Landsat data, Robert Simmon, Google Earth, 2000 )
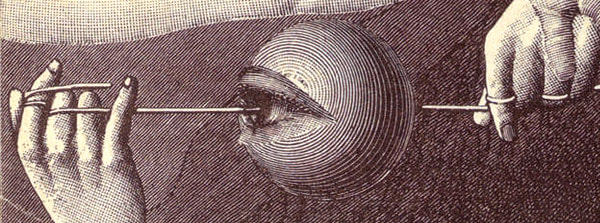
In the spring of 2019, I travelled to Jeju island, an eye-shaped volcanic landmass staring upwards off the southern coast of the Korean peninsula. I'd been invited by the Korean artist Mikyung Oh and her husband, the sculptor Do il, to take part in a group residency in connection with the Chusa Memorial Museum, during which time the selected artists were asked to respond to the works of the legendary Korean scholar and calligrapher after whom the museum is named (fig. 2).
Mikyung and Do il's main studios are in Yongin city just south of Seoul, but they travel regularly with their daughter Yule to Mikyung's hometown on Jeju to maintain the family tangerine orchard. The residency program is run from Mikyung's family home there, alongside a barn converted by Do il in to studio space. Once all the artists had arrived at the orchard we were welcomed by a Kayagum concert held beneath the heavy bows of one of Jeju's ancient Hackberry trees. Afterwards, we set about exploring the island and learning more about it's most famous historical resident Chusa Kim Jeong-hui, exiled scholar and man with two hundred names.
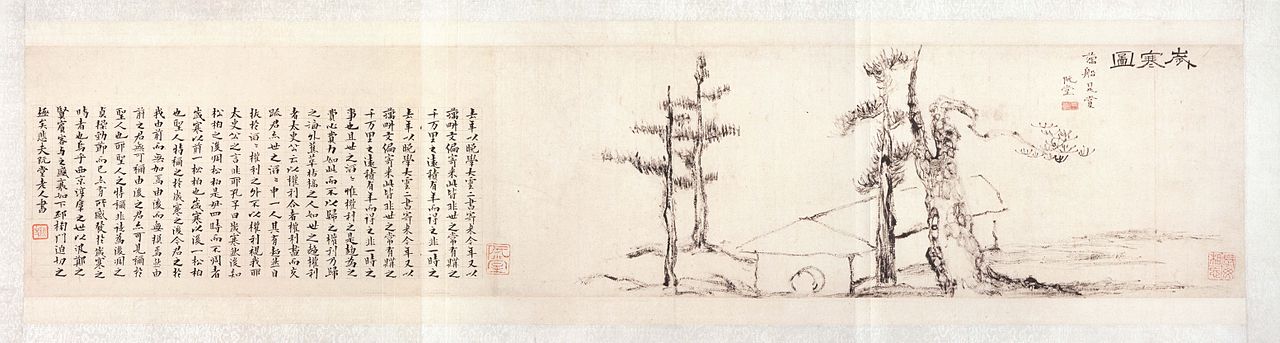
figure 3: Chusa Kim Jeong-hui’s masterpiece Sehando (A Winter scene),
1844, National Treasure #180 ( public domain )
Geology and the molten roots of an island
|
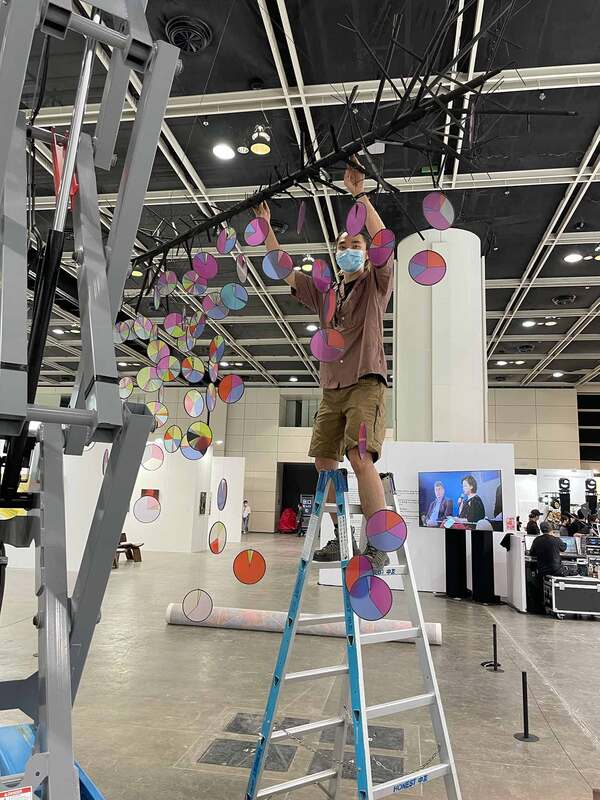
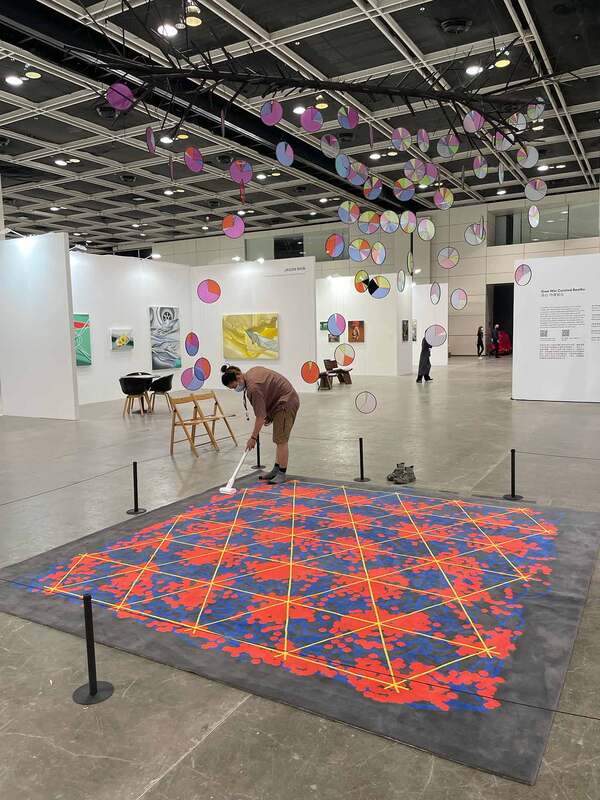
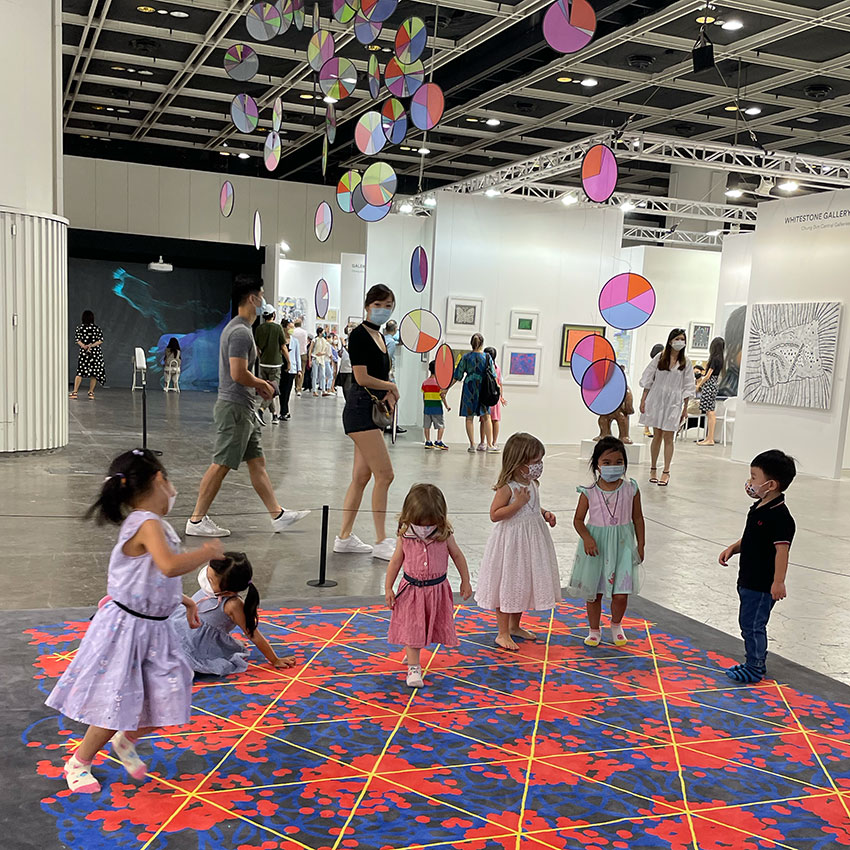
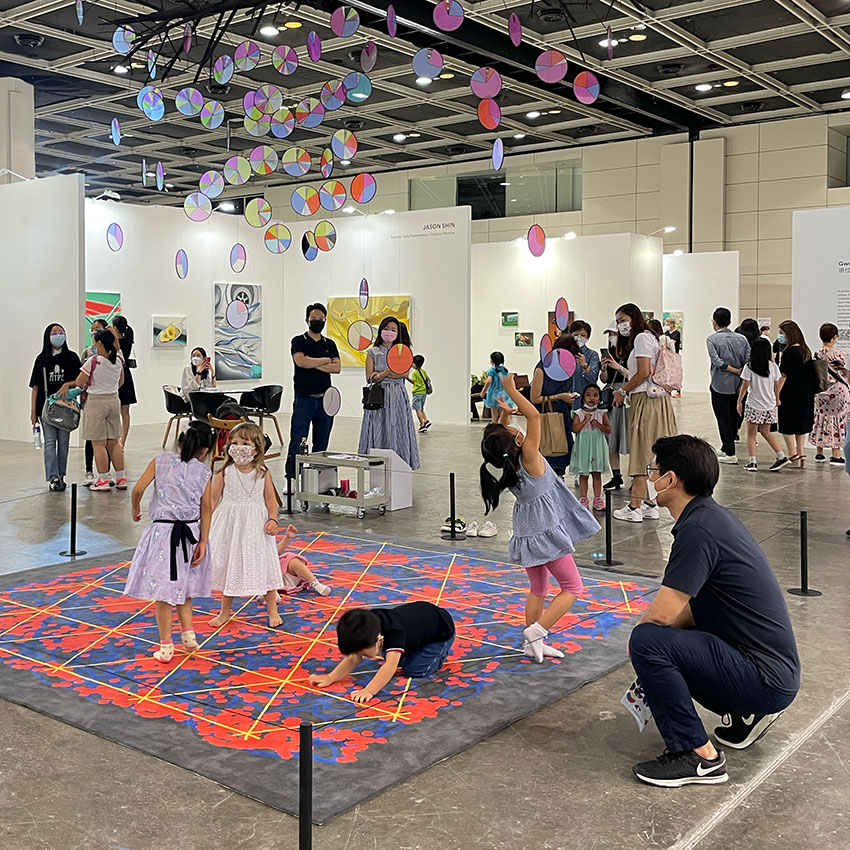
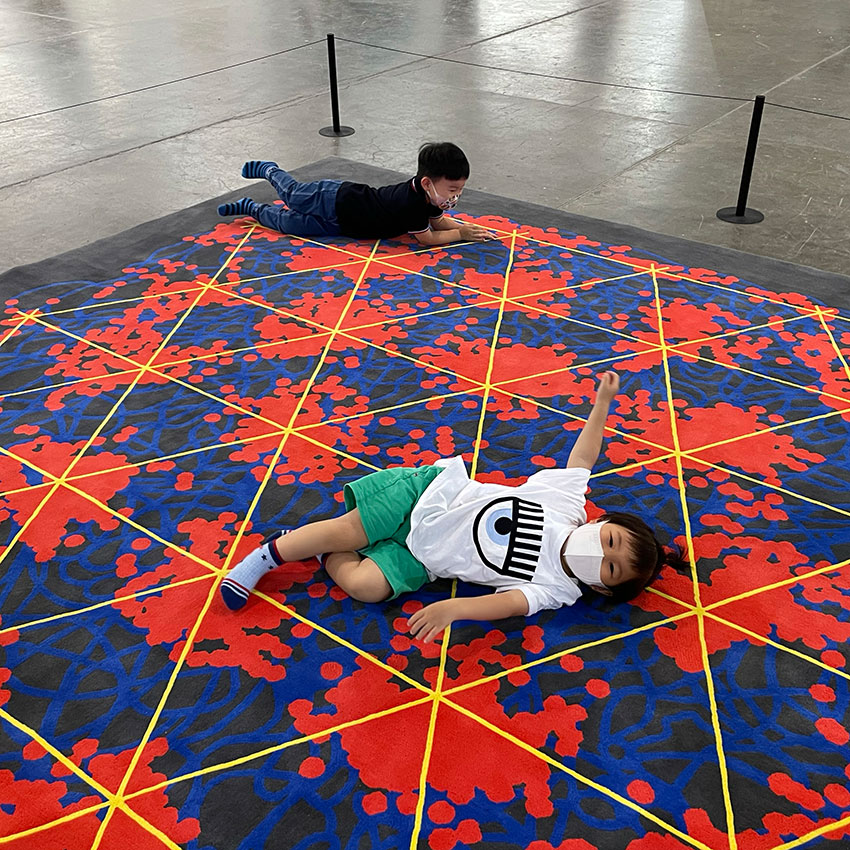
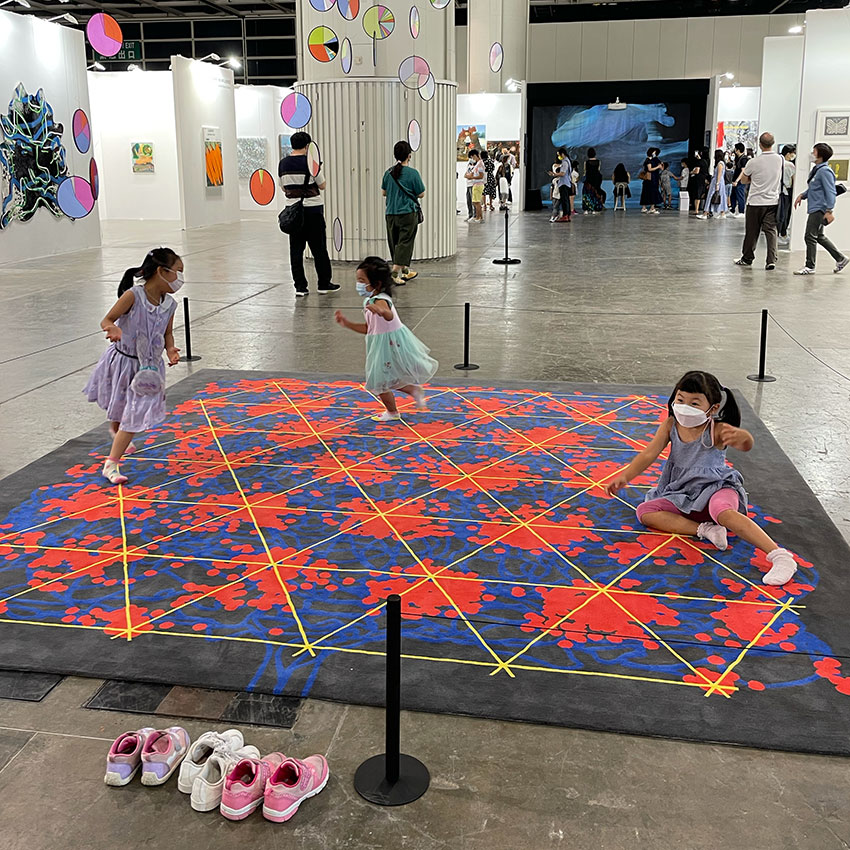
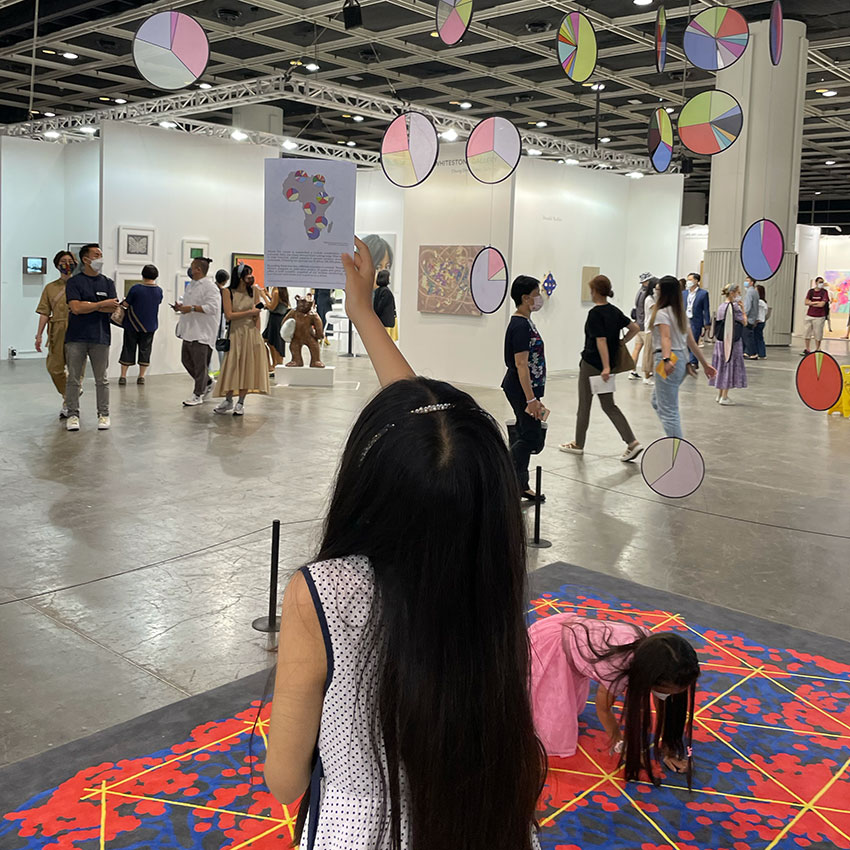
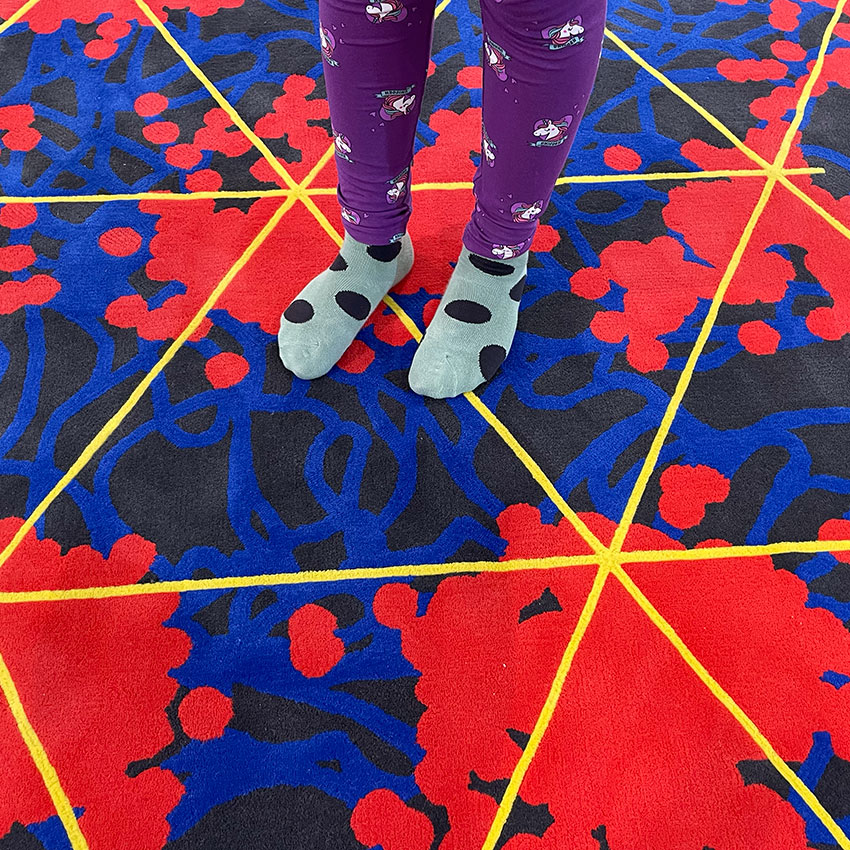
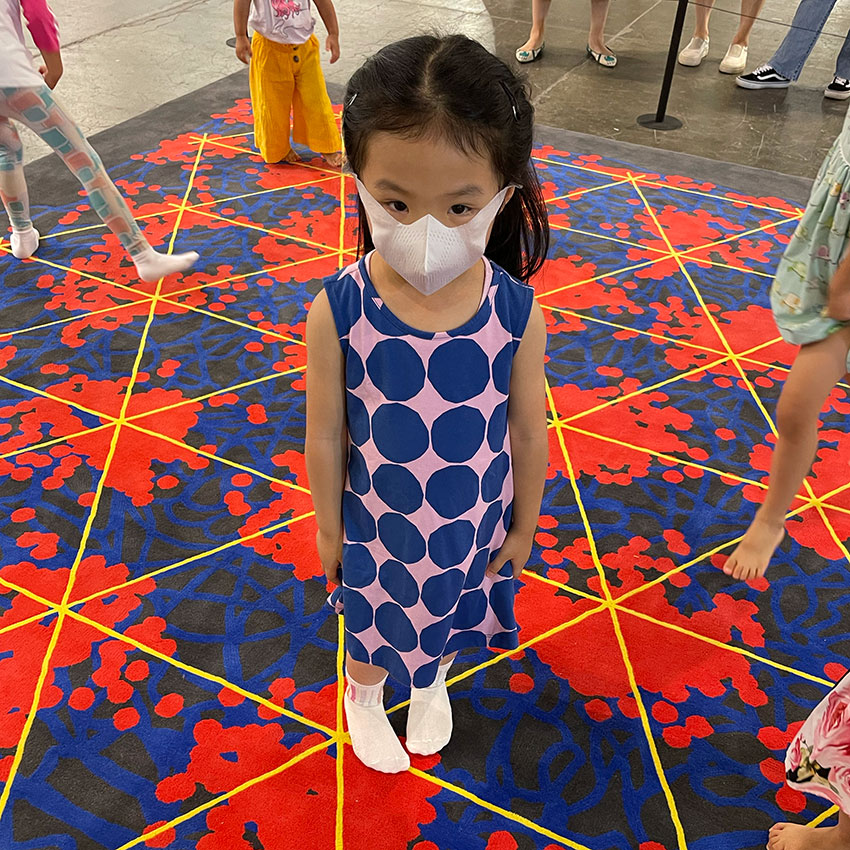
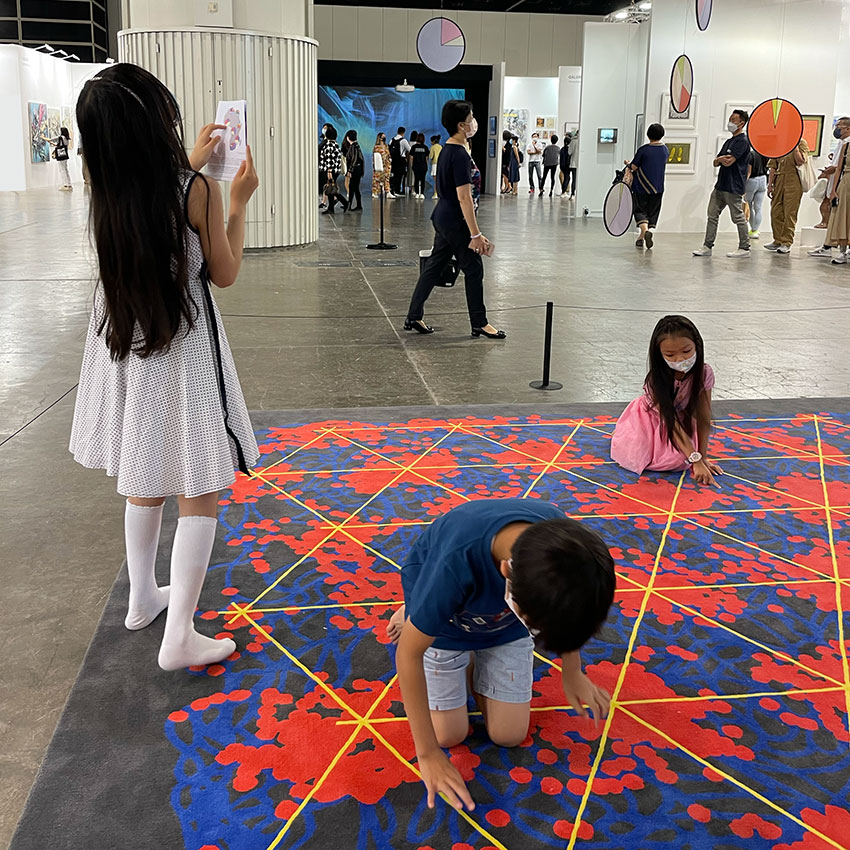
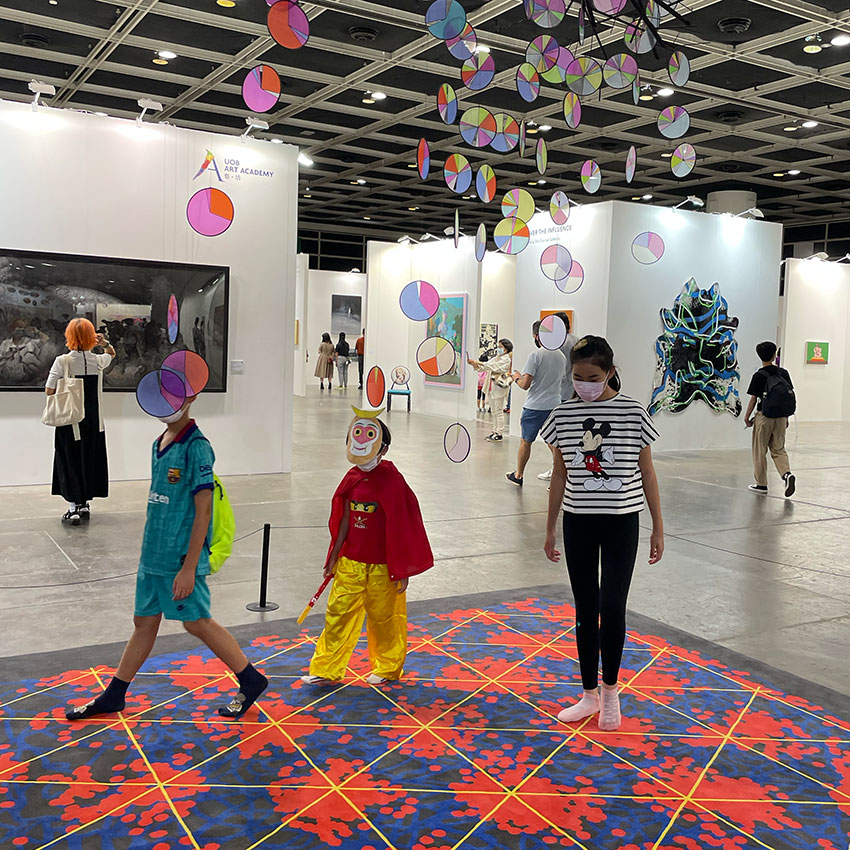
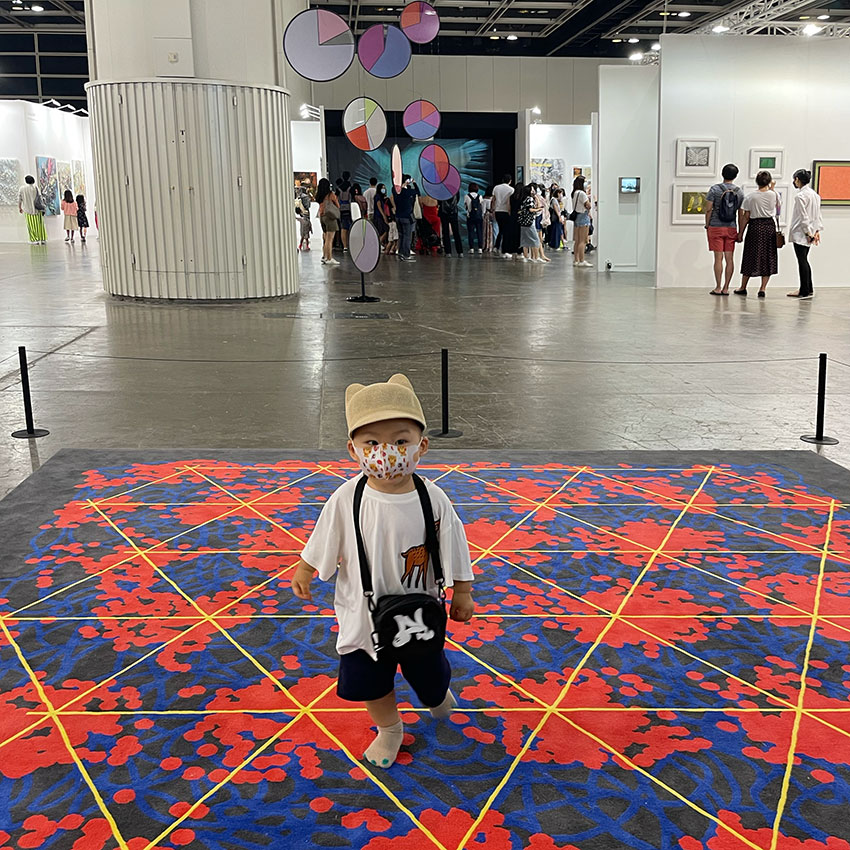
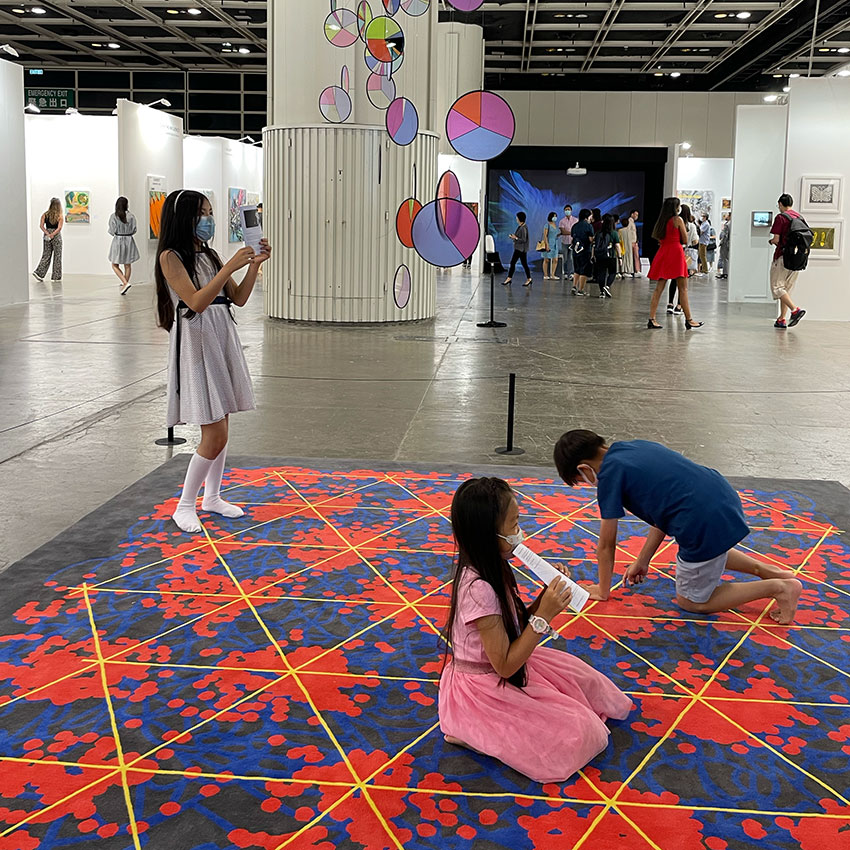

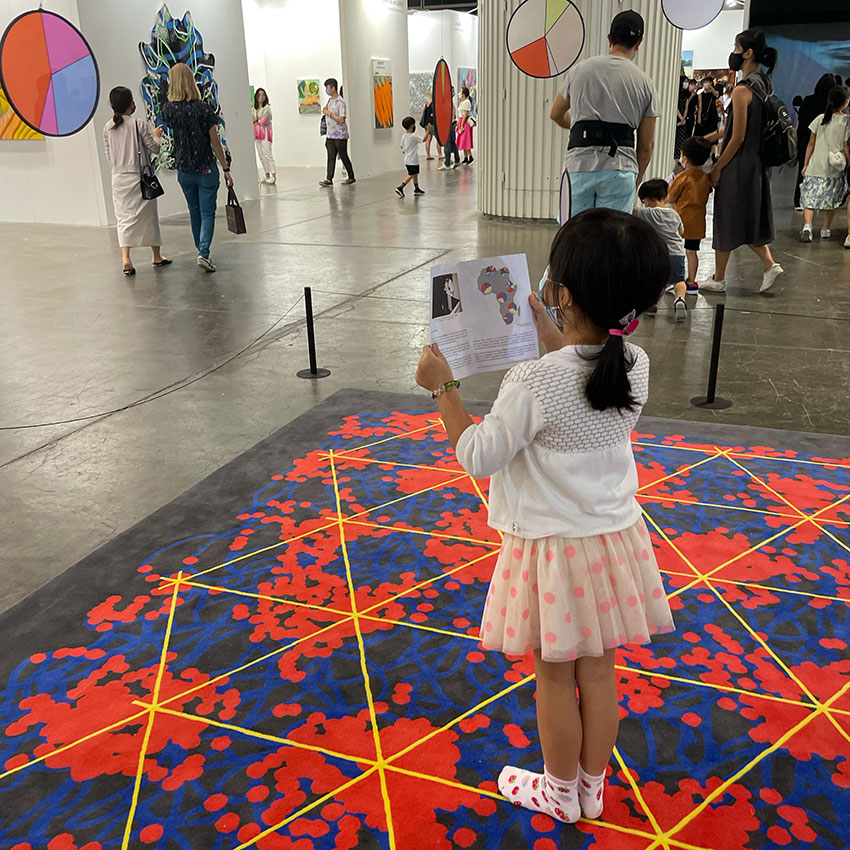
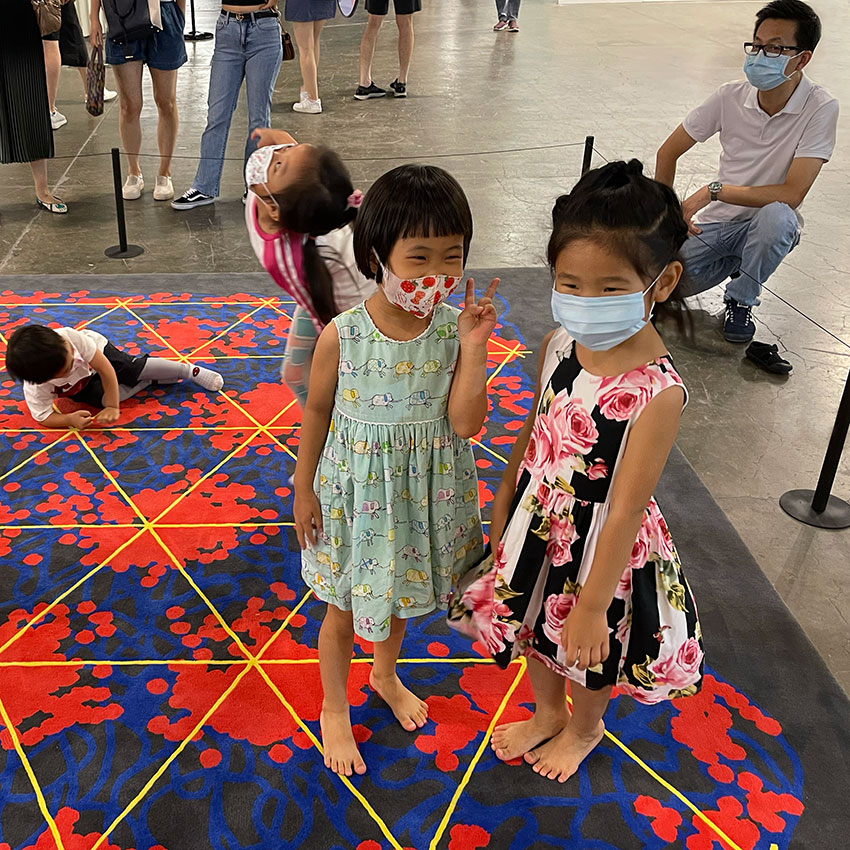
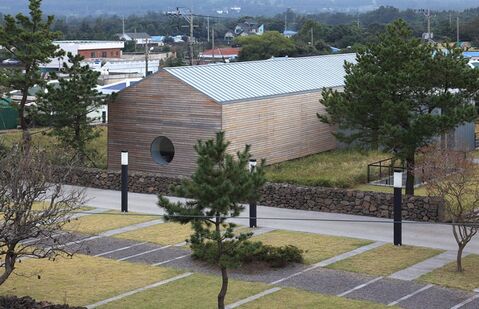
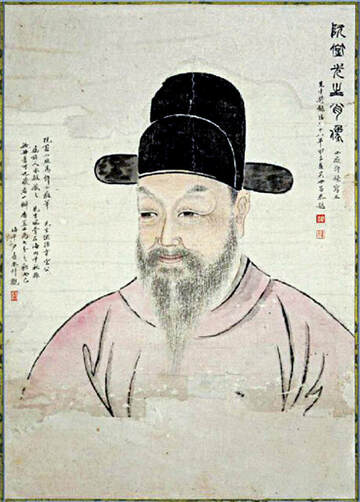
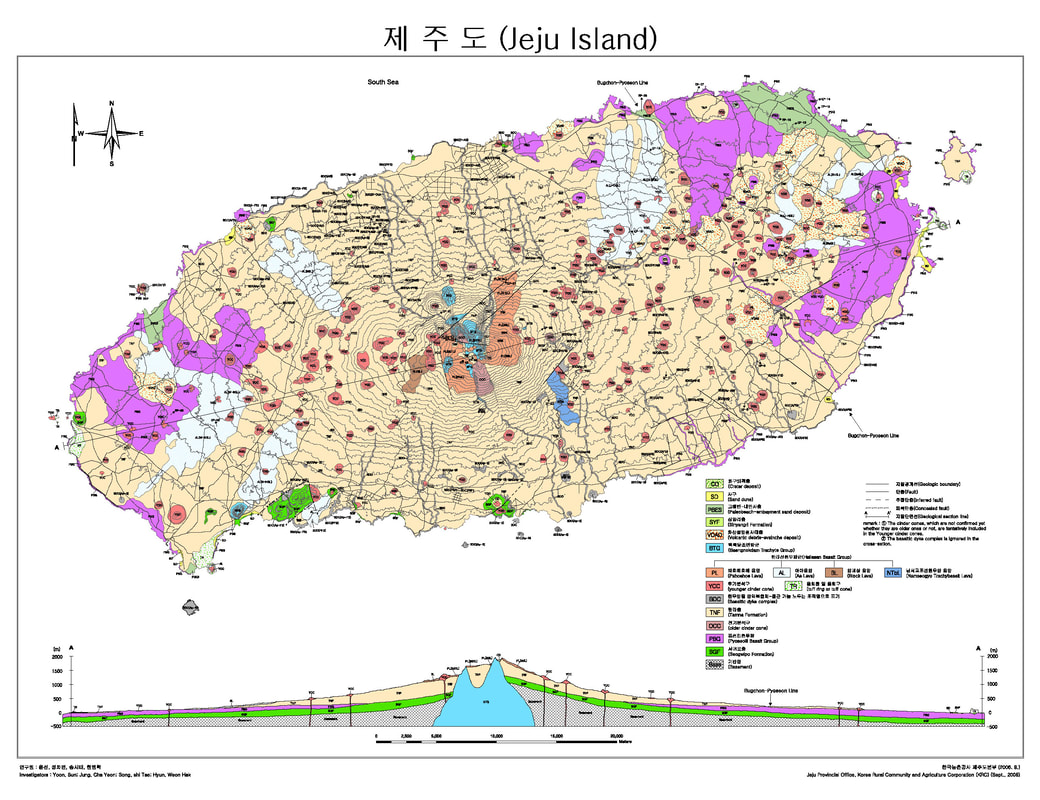
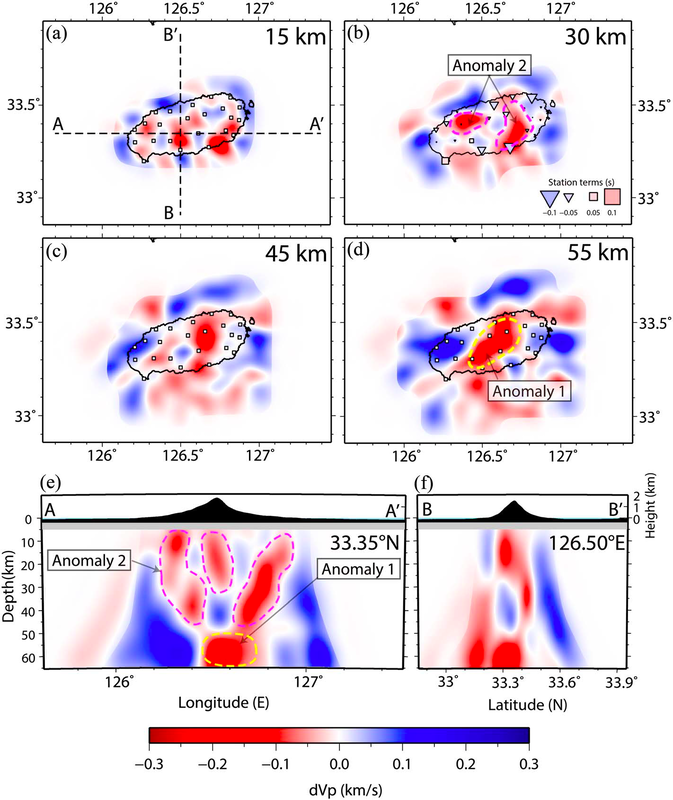
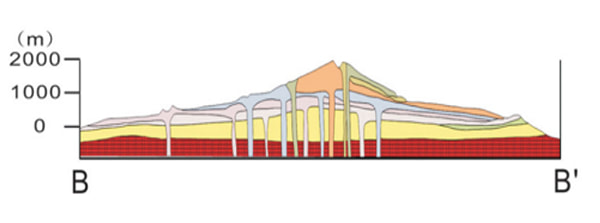
figure 6: Diagrams of Lithospheric Structures Beneath Jeju Island
Image courtesy of Jung-Hun Song (CC BY-NC-ND 4.0) |
Between 2013 and 2015, a team of Geologists from Seoul and Busan used 20 seismographic stations across the island to record waves passing through the earth from the 484 different earthquakes that had occurred in neighboring regions during that period.
Earthquake waves are known to travel at different speeds through different types of rock. By carefully comparing the arrival times of the waves at each station against which routes they had taken through the earth, (a process known as 'Teleseismic Traveltime Tomography'), the scientists were able to model the enormous bodies of magma beneath Jeju, giving us our first look at the vast molten roots of the island and a clearer understanding of how these systems develop (fig. 6). |
The geology and vegetation of Jeju are in fact so unusual, that large tracts of the island are now protected by law under Unesco World Heritage status. One of the island's major geological features was unwittingly discovered by a farmer installing electricity cables, who watched as one of his posts vanished in to the ground before him. The pole had broken through the roof of a cavernous Lava-tube full of rare rock formations, and large sections of these tunnels are now open to the public, with others being continually discovered thanks to less invasive techniques such as ground penetrating radar.
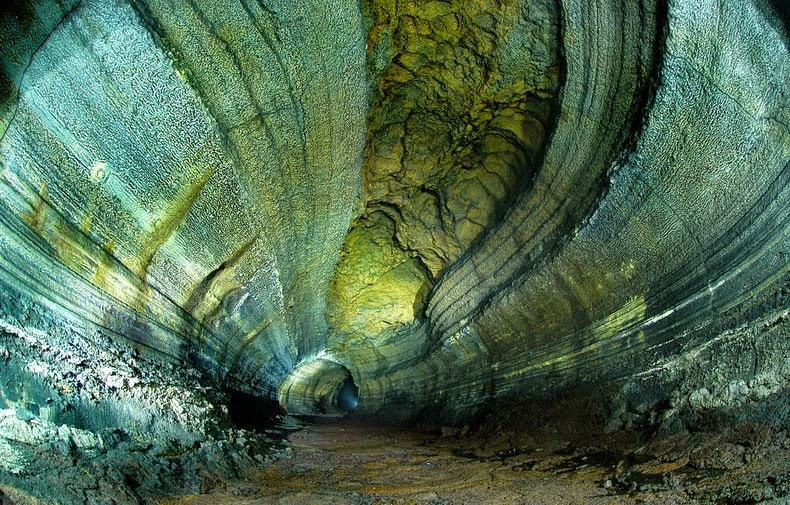
figure7: Section of a lava tube system in the North East of Jeju island
Biology and the genetic roots the orchid
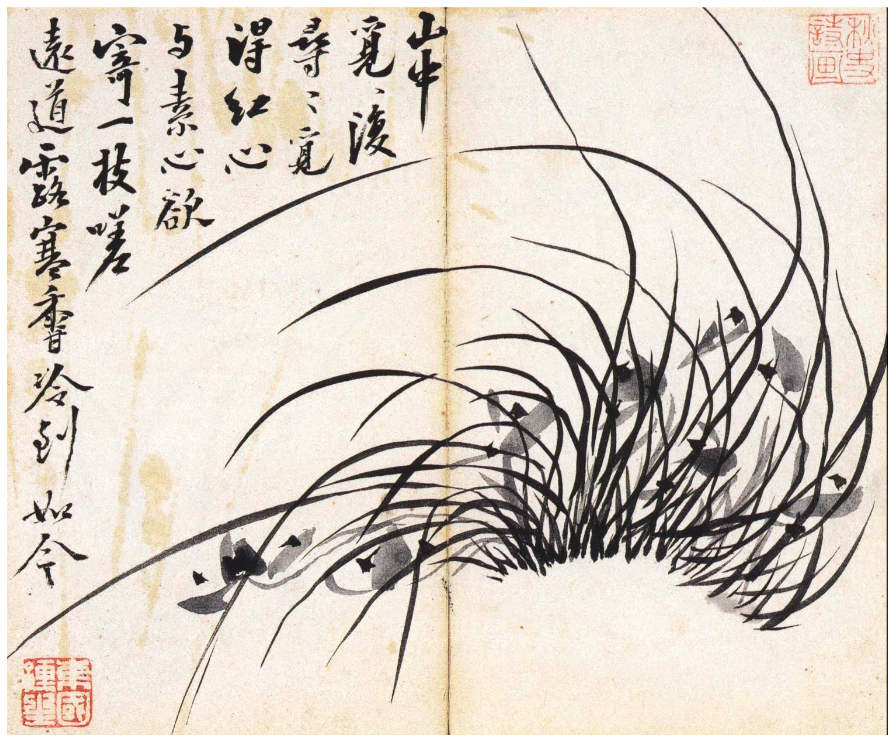
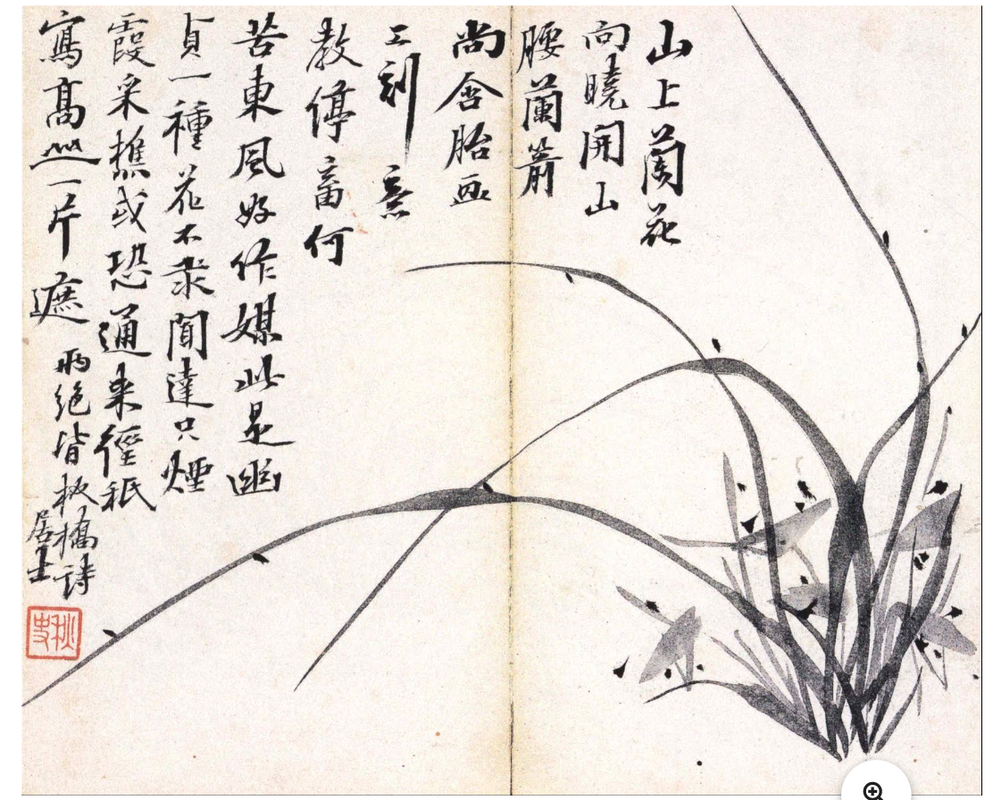
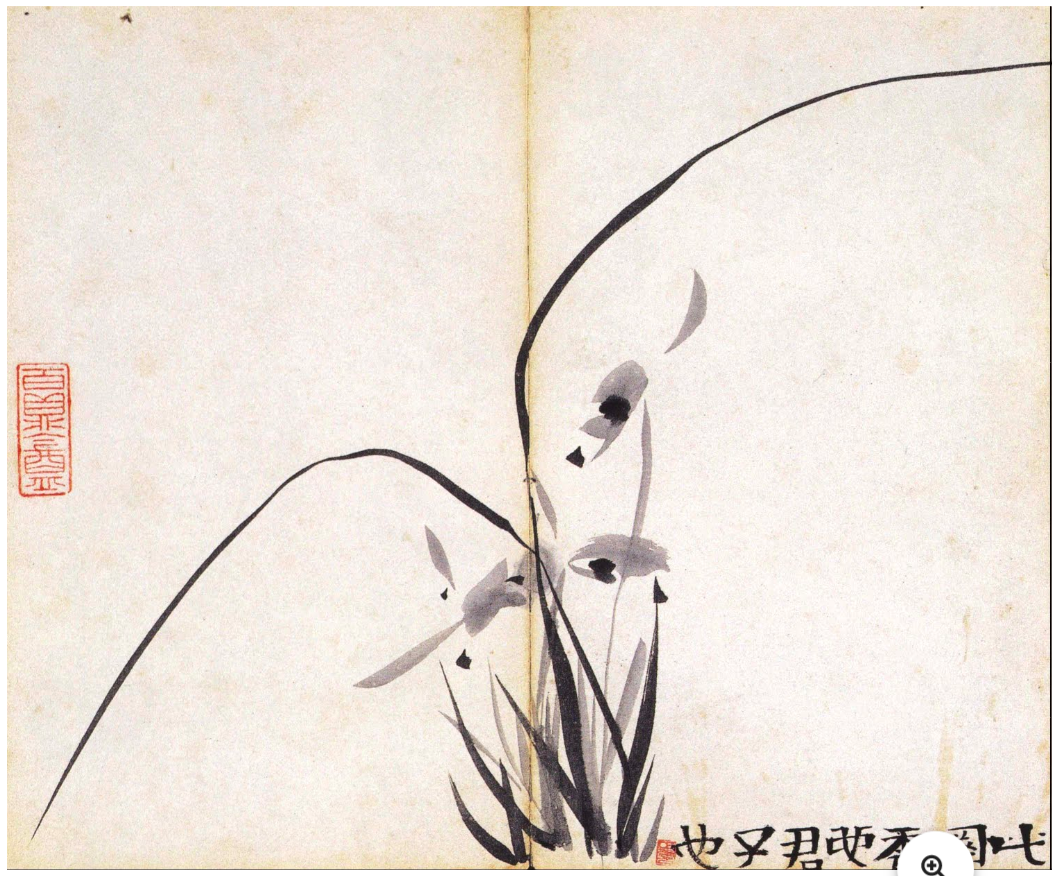
During his time on Jeju, Chusa wrote letters and poems to friends and students, taught classes at a local school and wandered the island to pick tea leaves and sketch the local orchids. One of the ‘four noble gentlemen’ of traditional Chinese painting, orchids are renowned for their ability to grow and blossoms in barren environments, and scholar-artists used them as a visual metaphor for resilience, nobility and humility, and as a symbol of friendship and loyalty.
Chusa's brush of choice was made of rat’s whiskers, a material which he found combined strength with sensitivity, and also allowed him to abruptly change the direction of his stroke whilst painting. With each new painting he would often coin a new 'Ho' or pen-name when signing the piece, to suggest a particular persona in association with the image.
Chusa's brush of choice was made of rat’s whiskers, a material which he found combined strength with sensitivity, and also allowed him to abruptly change the direction of his stroke whilst painting. With each new painting he would often coin a new 'Ho' or pen-name when signing the piece, to suggest a particular persona in association with the image.
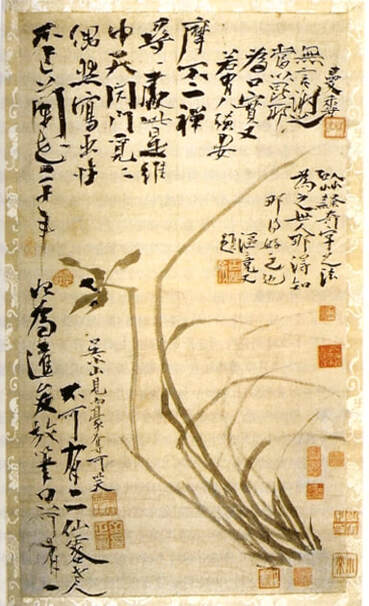
figure 8: Orchid painting, Chusa
(unknown date, public domain) |
Over his life time Chusa created over 200 different pen-names for his calligraphy, poems and paintings, and according to his own accounts, in his 70 years he wore down 10 ink stones and 1,000 brushes whilst developing the distinctive Chusa style or 'Chusache'.
His most famous orchid masterpiece is said to have been made after not having painted a single orchid for 20 years, created in an absent minded moment as a gift for his young servant (figure 8). It's unlikely that his servant appreciated what he'd been given, but a local artisan certainly knew it's worth and continued to beg and pester Chusa for the scroll until it suddenly one day disappeared. Later, Chusa wryly added this tale to the painting itself in his unique 'Chusache' script (fig. 8). |
Thanks to their ability to migrate and develop to suit different conditions, orchids have evolved in to an extraordinarily diverse family of plants. Their highly specialised roots have allowed them to colonize not only the inhospitable lava rocks and quick draining soils of Jeju, but almost every habitat on Earth, except Antarctica.
Around 10% of all flowering plants species are now known to be orchids, with somewhere between 20,000 and 30,000 species and over 70,000 hybrids and cultivars. Scientists are currently in the process of mapping out the extensive evolutionary lineage of orchids and in 2017, a study published in Nature Magazine announced that an international consortium of researchers had sequenced the genome of Apostasia shenzhenica, a primitive 'Grass Orchid' whose appearance is only barely recognisable as an orchid.
By comparing it's genome with known sequences in other species, they were able to estimate the time at which it diverged or 'split off' from other orchids. Their study also gives us a better idea of when the 'Most Recent Common Ancestor' (MRCA) of all orchids existed, now believed to be around 200 million years ago at the dawn of the age of the dinosaurs (figure 9).
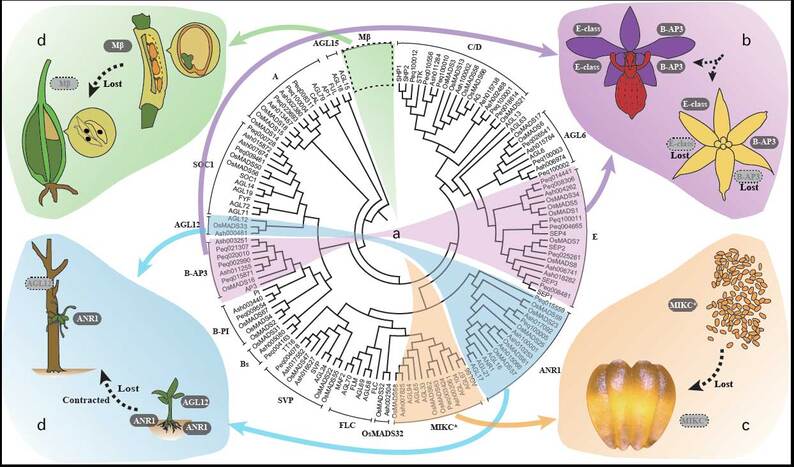
figure 9: Phylogenetic tree diagram of MADS-box genes involved in orchid morphological evolution.
Image courtesy of Jie-Yu Wang and Rolf Lohaus (CC BY 4.0)
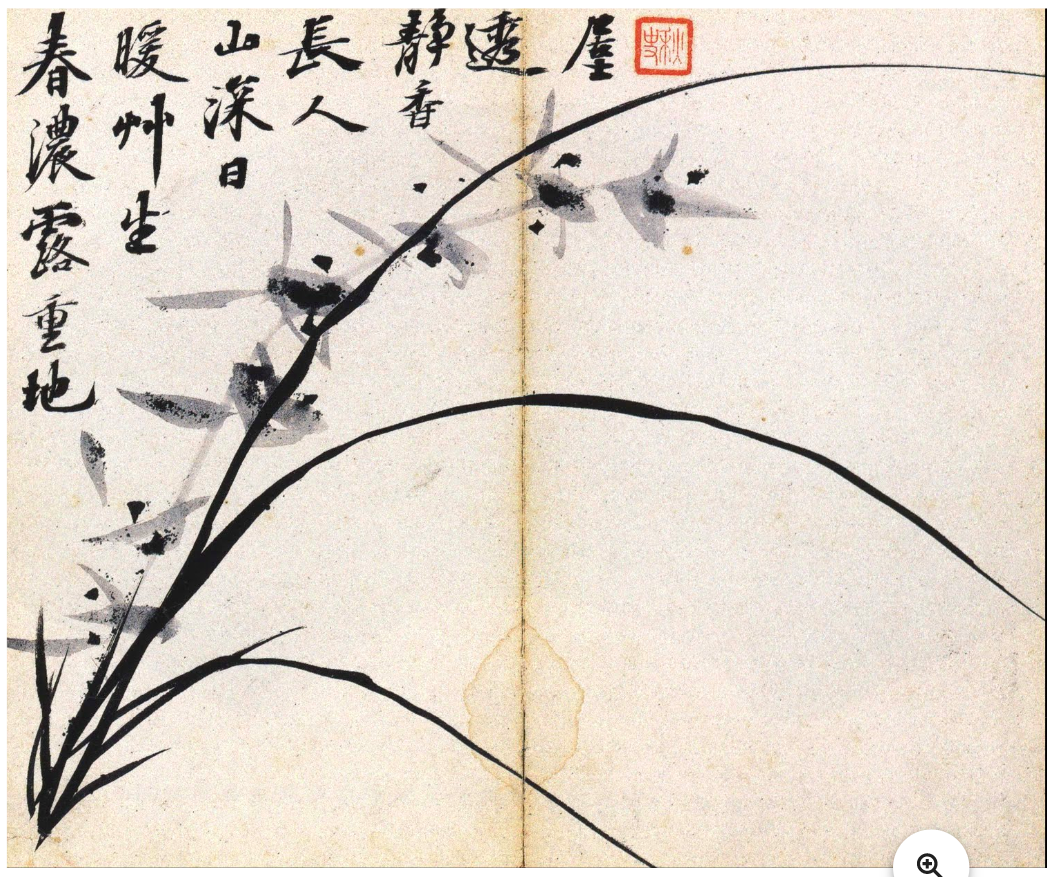
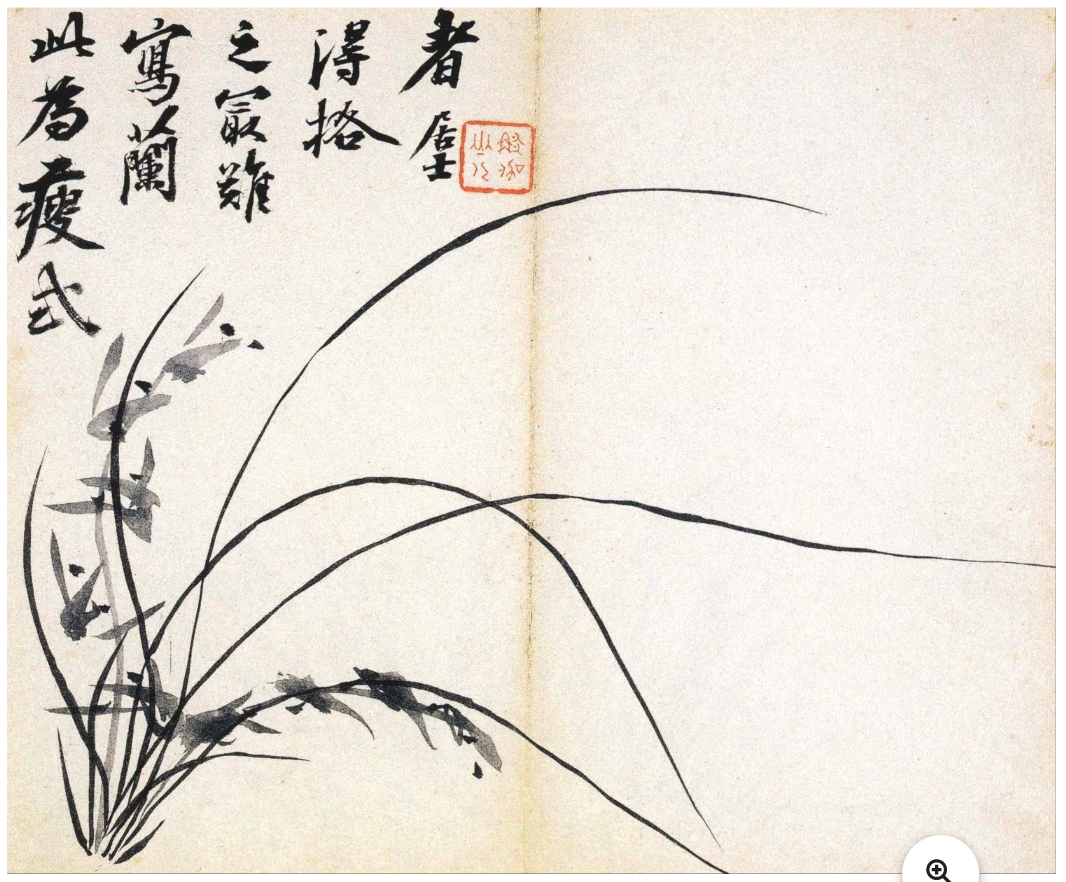
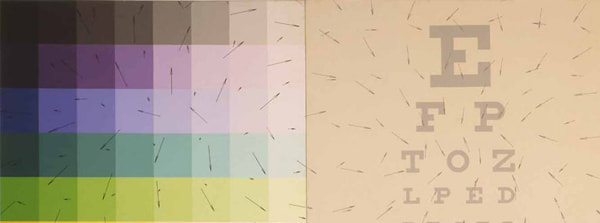
Critical appreciation of traditional Korean painting often involves an awareness of the negative space or unpainted regions of an art work, and several of Chusa's orchid paintings use the white of the paper at the base of the leaves and stalks to suggest the terrain in which the flower grew (see below).
In developing the two new drawings for the residency on Jeju, I was interested in the notion of absence within an image - what an artist chooses to show and chooses not to, but also in terms of what can be said to lie hidden behind the surface appearance of the things which surround us.
Written within the fabric of nature is evidence of innumerable events that occurred in deep geological and evolutionary time in order for the volcanoes and orchids to exist, and it's only by means of years of collaborative investigation and ingenious new techniques, that we have come to be able to detect and decipher them.
As geologists diagram the molten roots beneath the rock on which Chusa wandered, and geneticists piece together the genetic roots which underlie each of Chusa's orchids, we have come to realise that these structures stretch backwards through space and time in ways that Chusa could never have imagined.
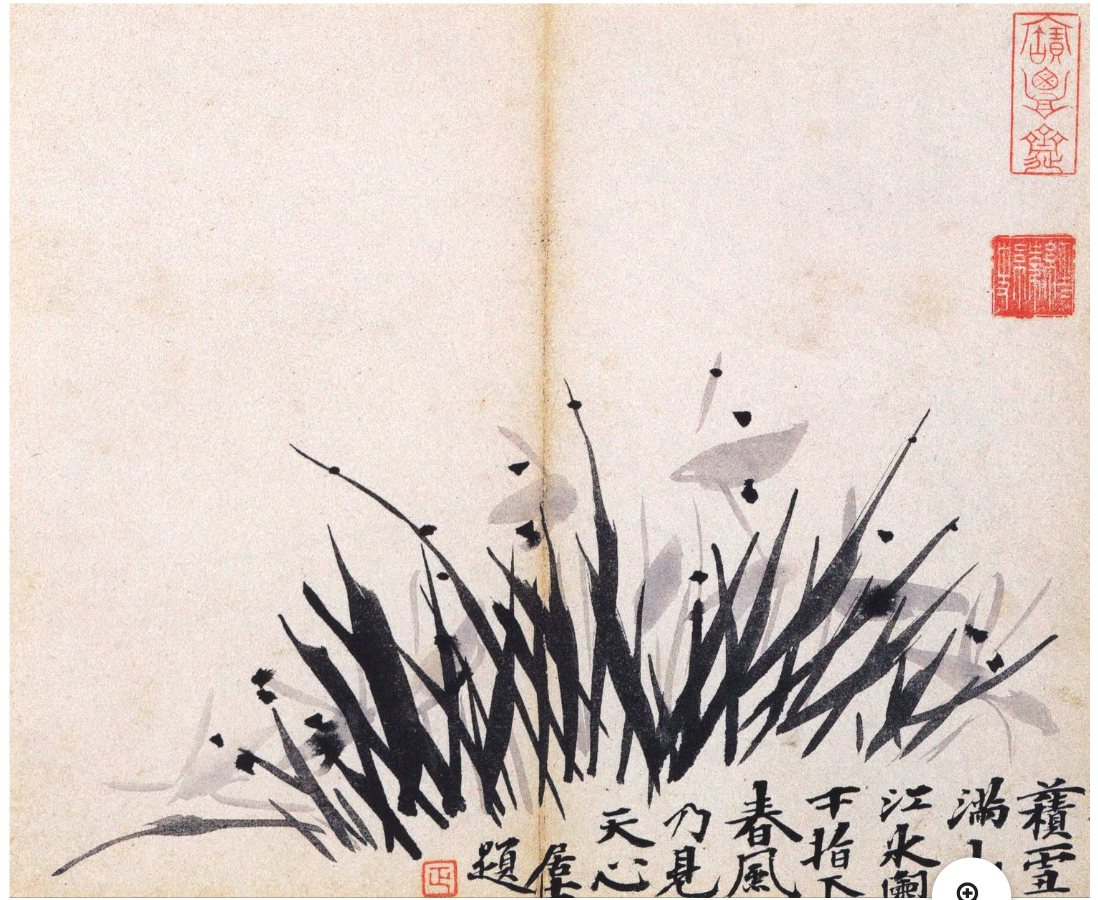
Below are high resolution images of each finished drawing, which can be viewed in detail using the control icons to the right of each image. Beneath these are a collection of Chusa's own orchid paintings, which now comprise a digitized collection available online here as part of Google's Arts and Culture Project.
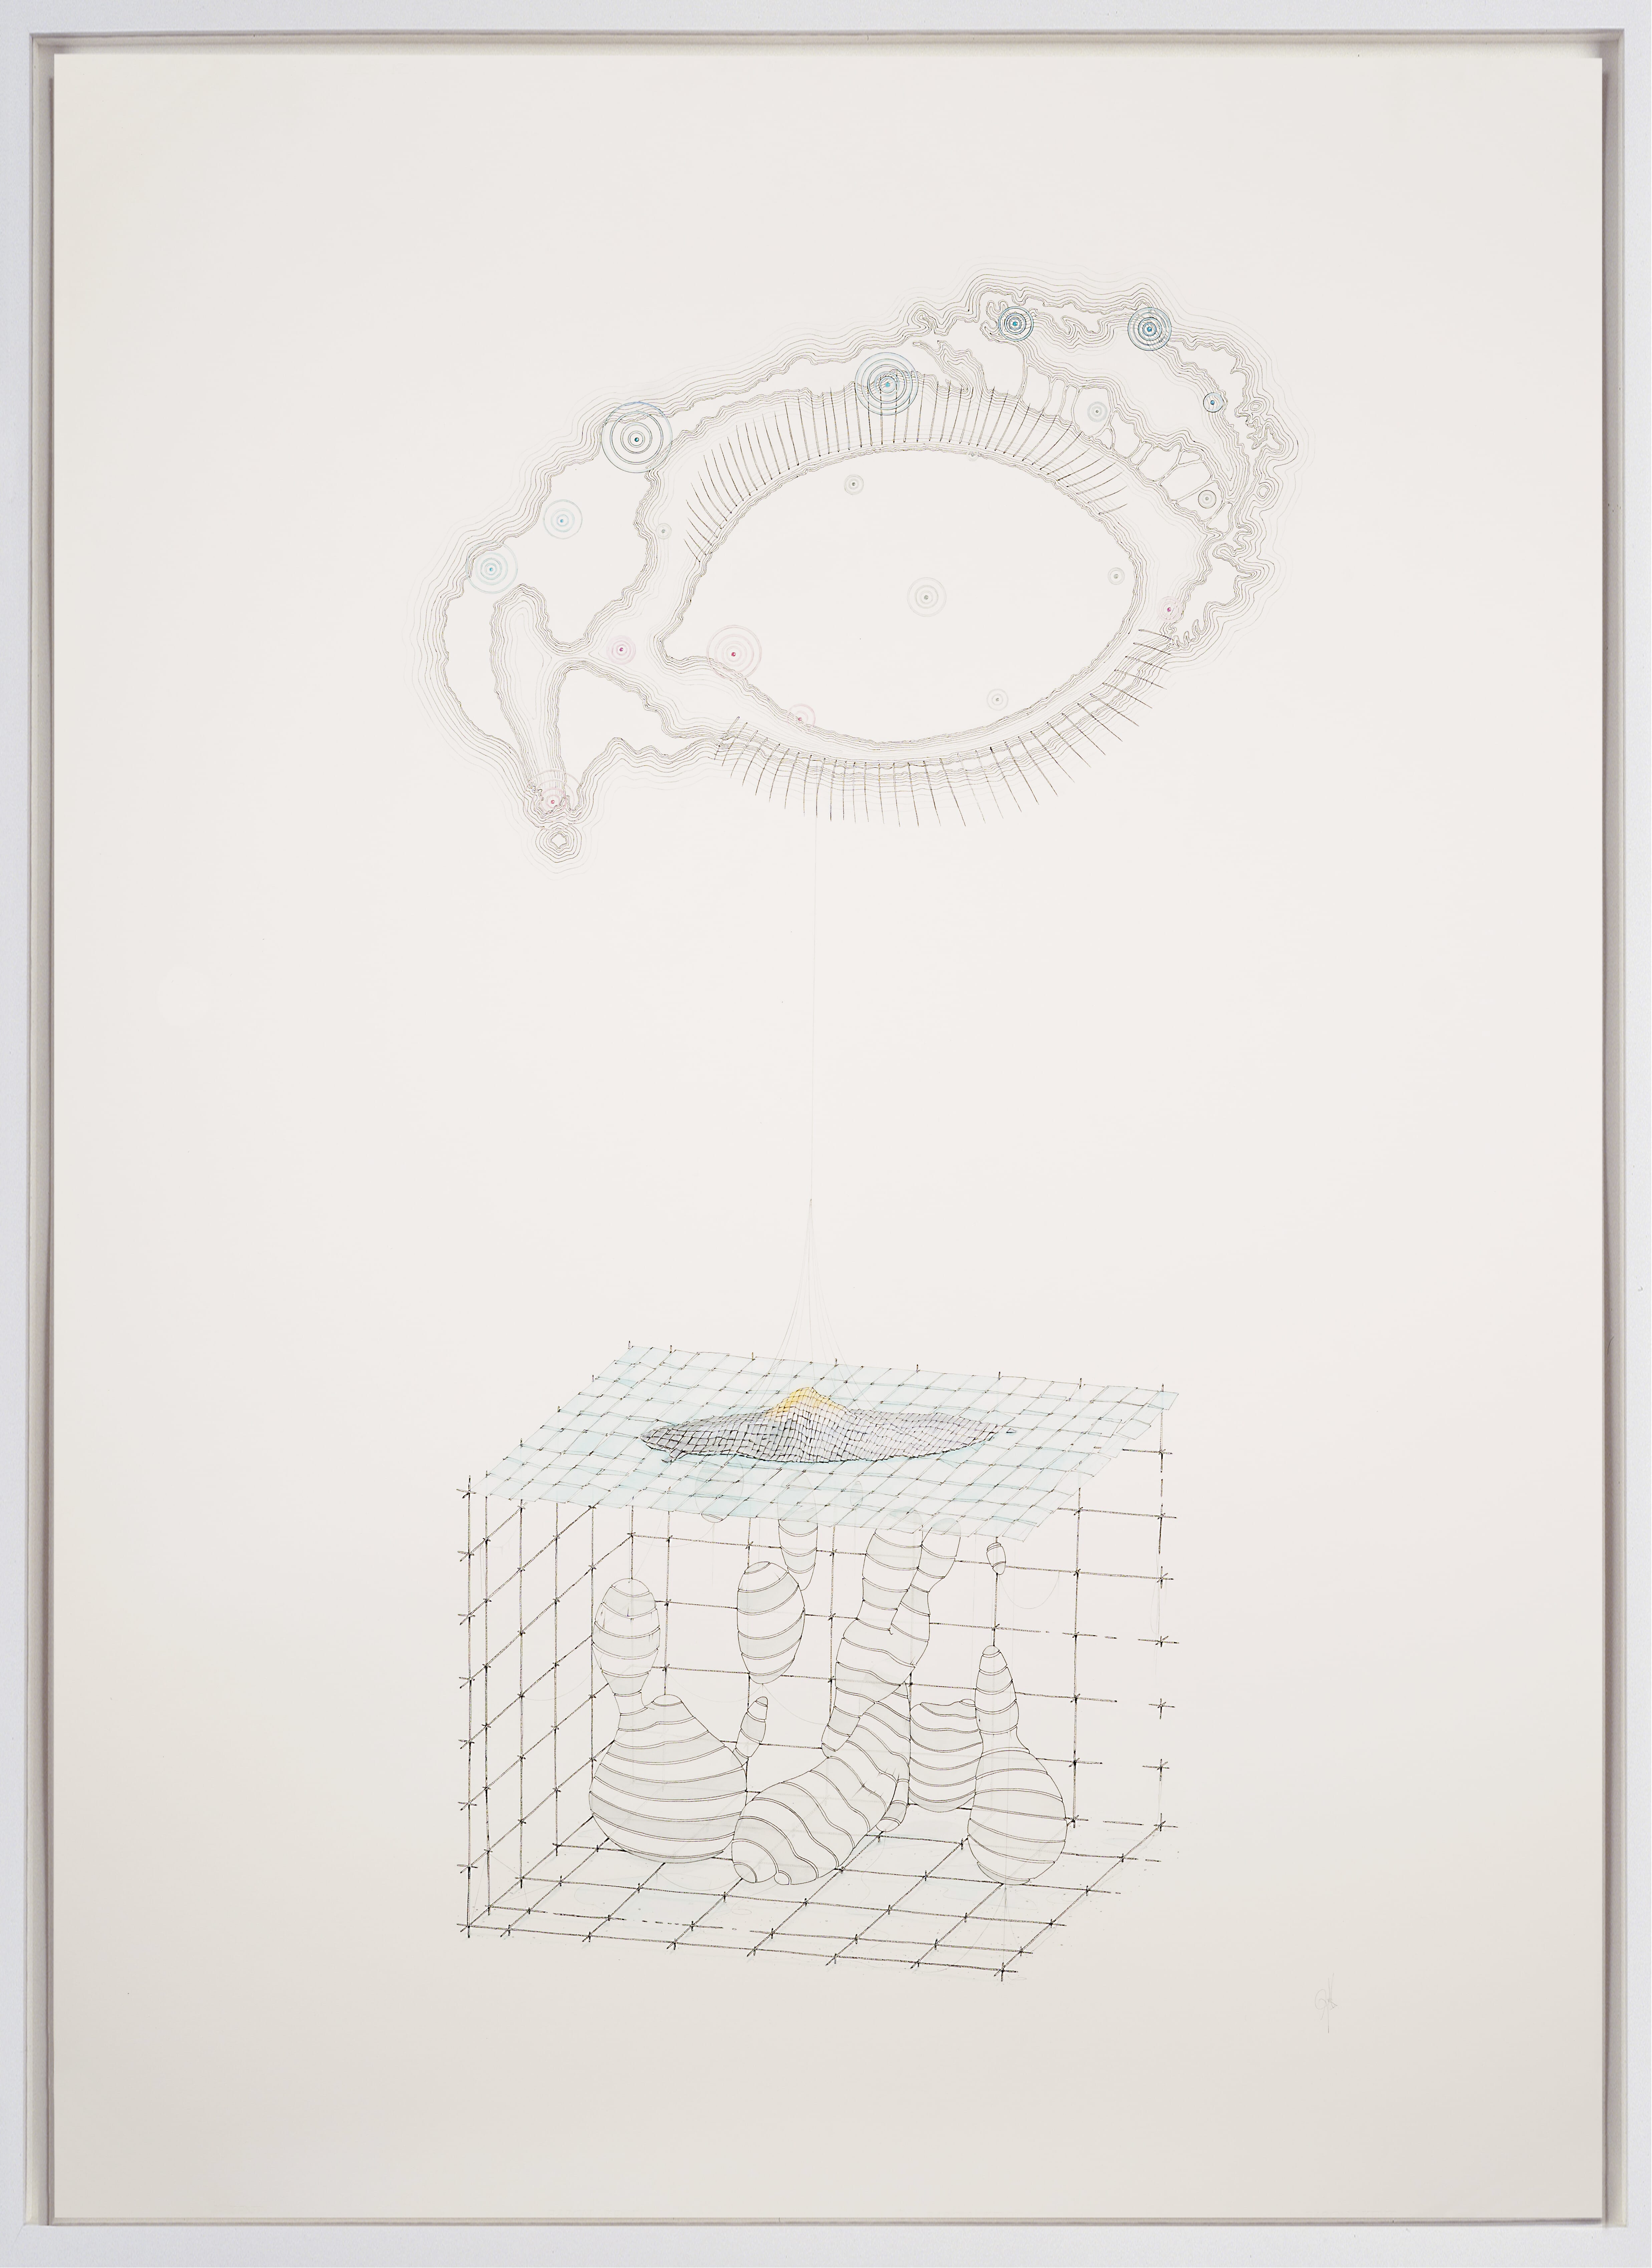
Tear glands, tear ducts, tear drops
(Lacrimal gland and ducts with Lithospheric anomalies)
Michael Whittle, 2019, Ink pencil and watercolour on paper, 111.2 x 78.9 cm
References:
Jung-Hun Song et.al., 2018, Imaging of Lithospheric Structure Beneath Jeju Volcanic Island by Teleseismic Traveltime Tomography, Journal of Geophysical Research: Solid Earth, 10.1029.
Online: https://doi.org/10.1029/2018JB015979
Jung-Hun Song et.al., 2018, Imaging of Lithospheric Structure Beneath Jeju Volcanic Island by Teleseismic Traveltime Tomography, Journal of Geophysical Research: Solid Earth, 10.1029.
Online: https://doi.org/10.1029/2018JB015979
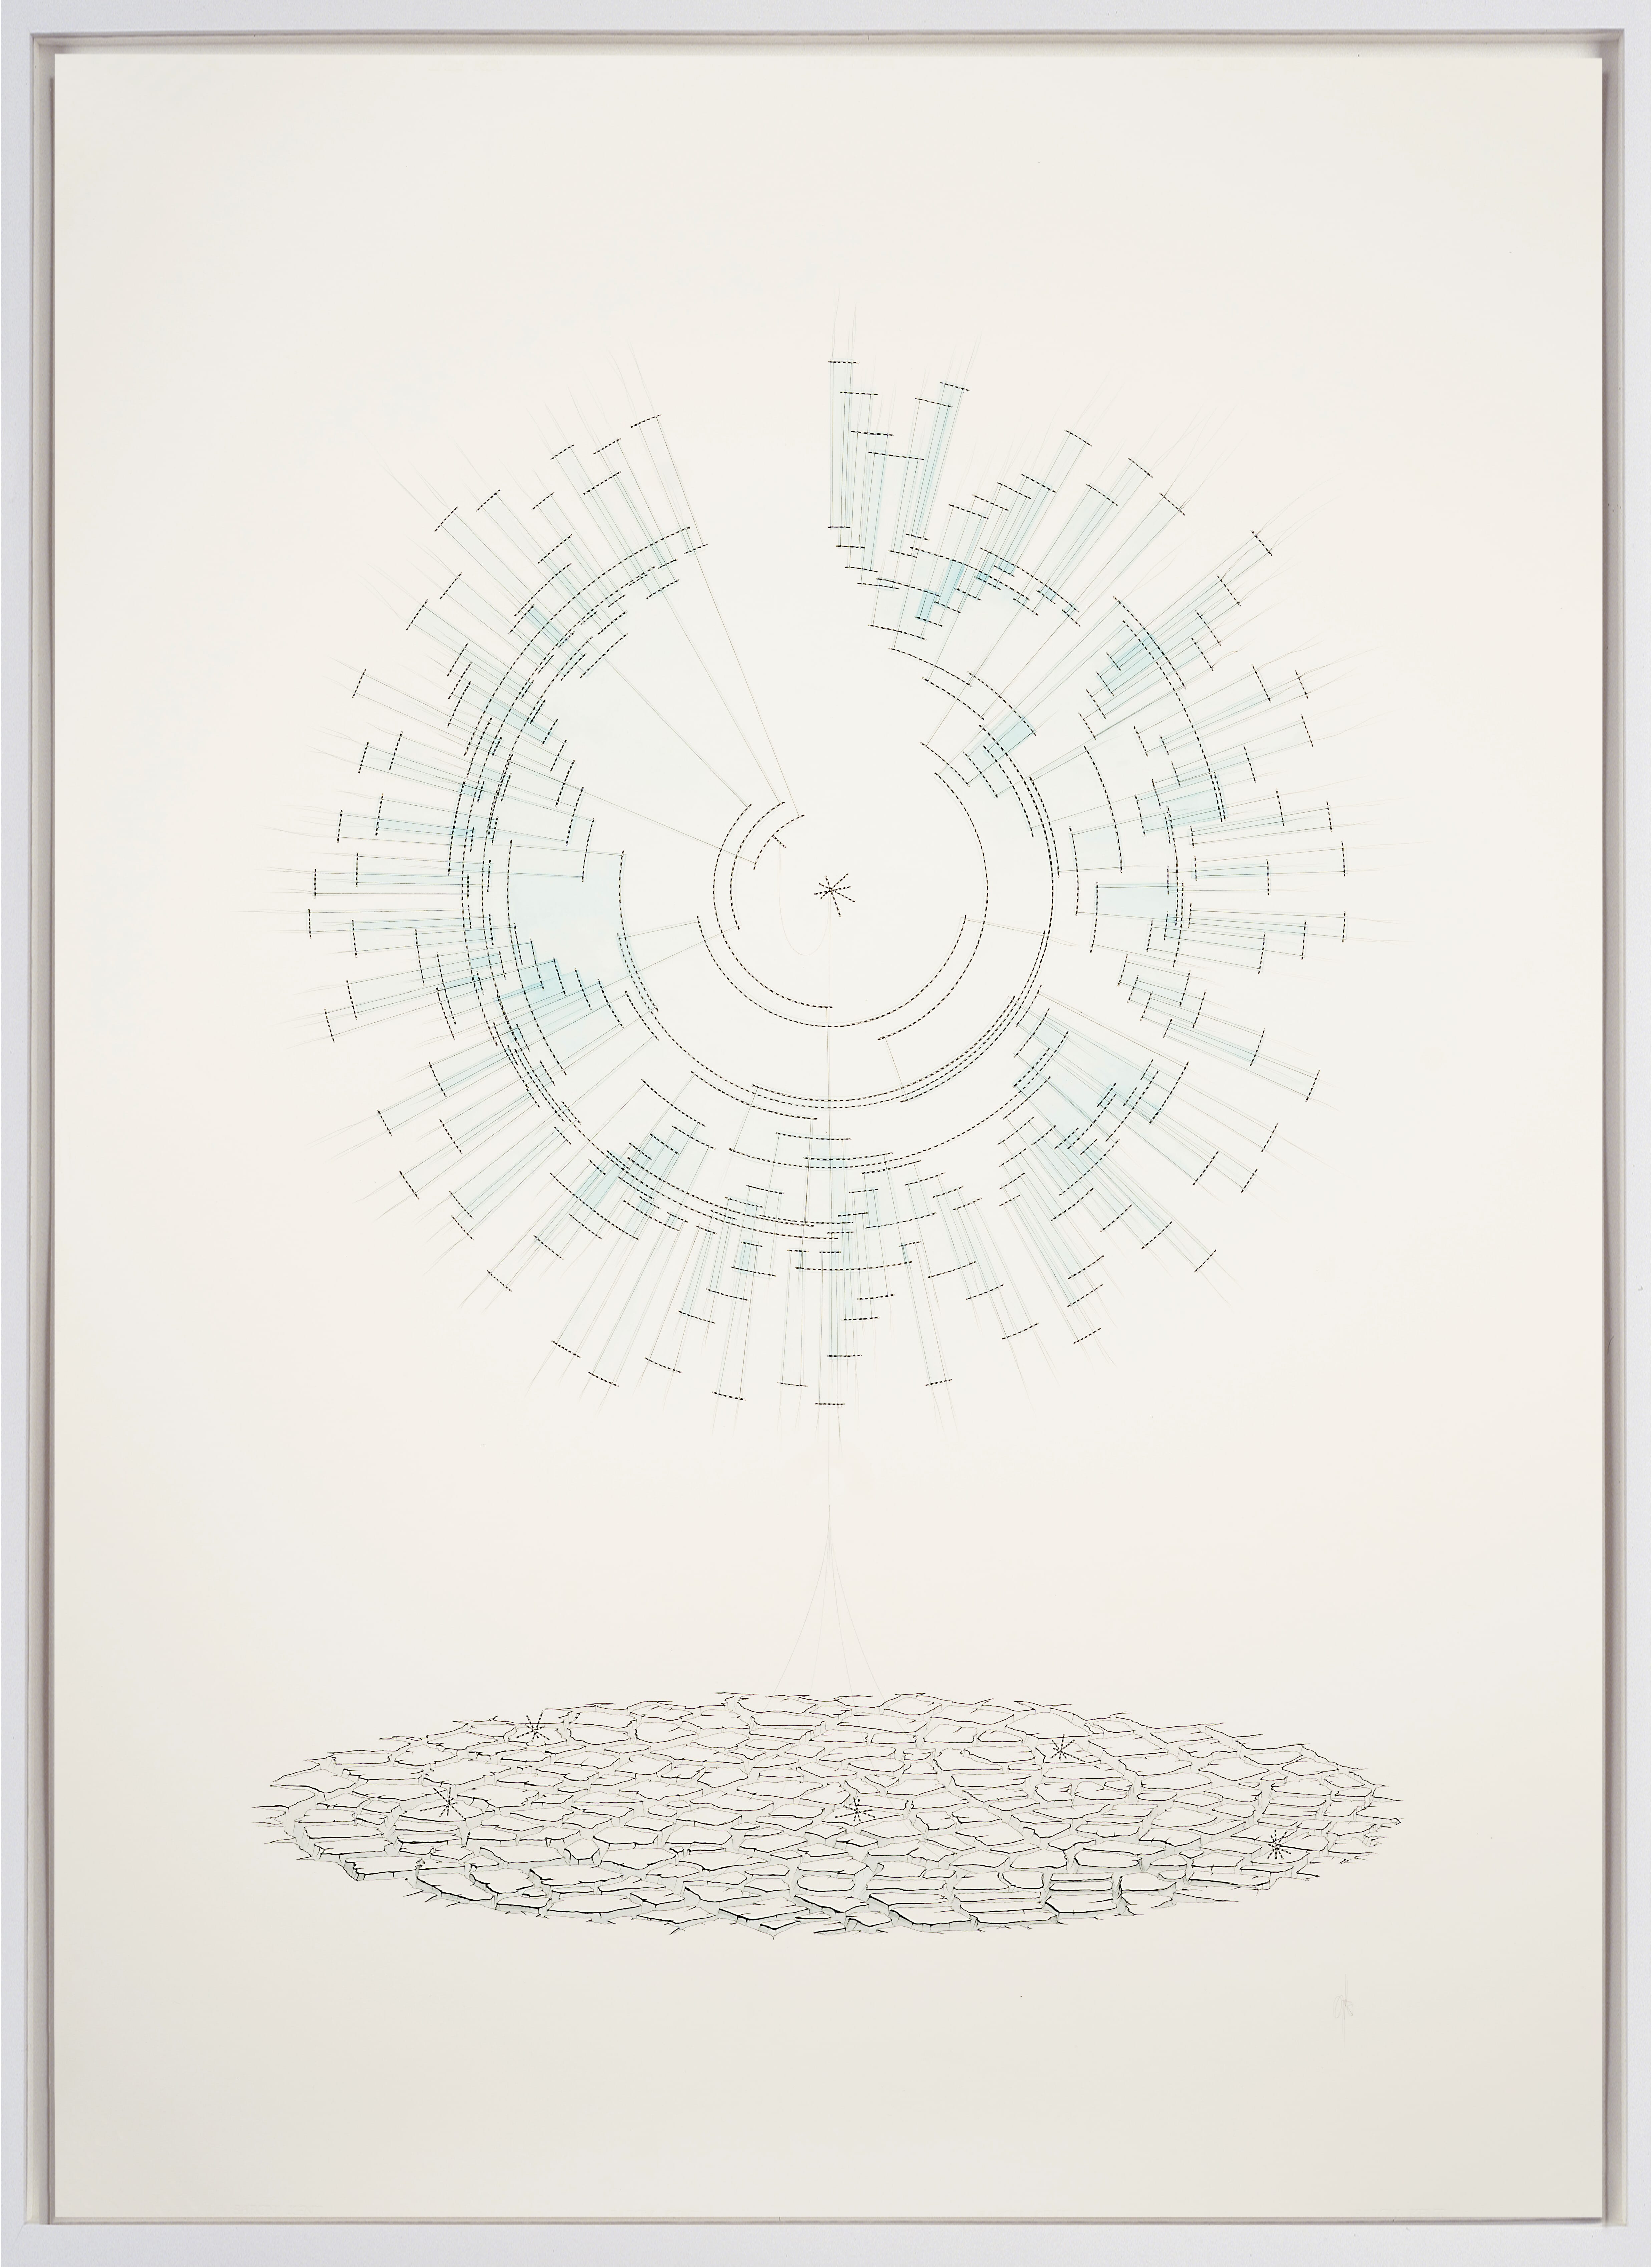
The roots of the Orchid
(Divergent phylogenetic tree with common ancestor and desiccation)
Michel Whittle, 2019, Ink pencil and watercolour on paper, 111.2 x 78.9 cm
References:
Guo-Qiang Zhang et.al., 2017, The Apostasia genome and the evolution of orchids. Nature 549: 379-383
Online: https://rdcu.be/bUj7h
Guo-Qiang Zhang et.al., 2017, The Apostasia genome and the evolution of orchids. Nature 549: 379-383
Online: https://rdcu.be/bUj7h
Chusa's Orchids:


Dr. Michael Whittle
British artist and
researcher based
in Macau
Posts:

Categories
All
Alchemical Art
Anatomy
Arakawa And Gins
Architecture
Bauhaus
Contemporary-art
Contemporary-art
Duchamp
Genetics
Geology
Geometry
JMW Turner
Leonardo Da Vinci
Literature
Mathematics
Medieval Art
Musicology
Oskar Schlemmer
Perspective
Physics
Romanticism
Sol LeWitt
Surrealism
Theatre
Archives
April 2024
December 2023
November 2023
September 2023
June 2022
June 2021
August 2020
October 2019
August 2018
January 2018
November 2017
October 2017
April 2017
November 2016
October 2016
September 2016
June 2016
May 2016
April 2016
March 2016