|
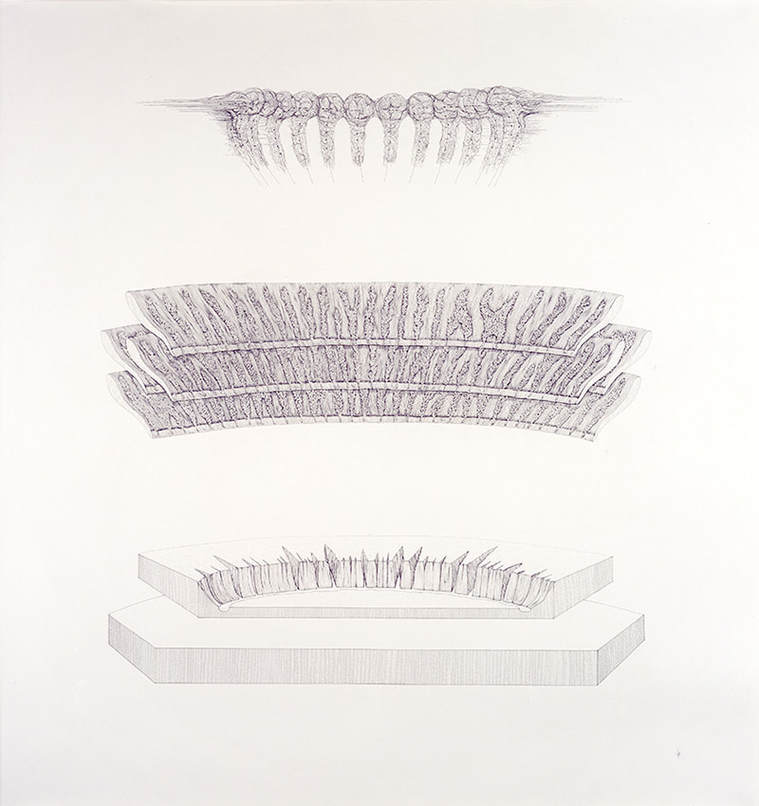
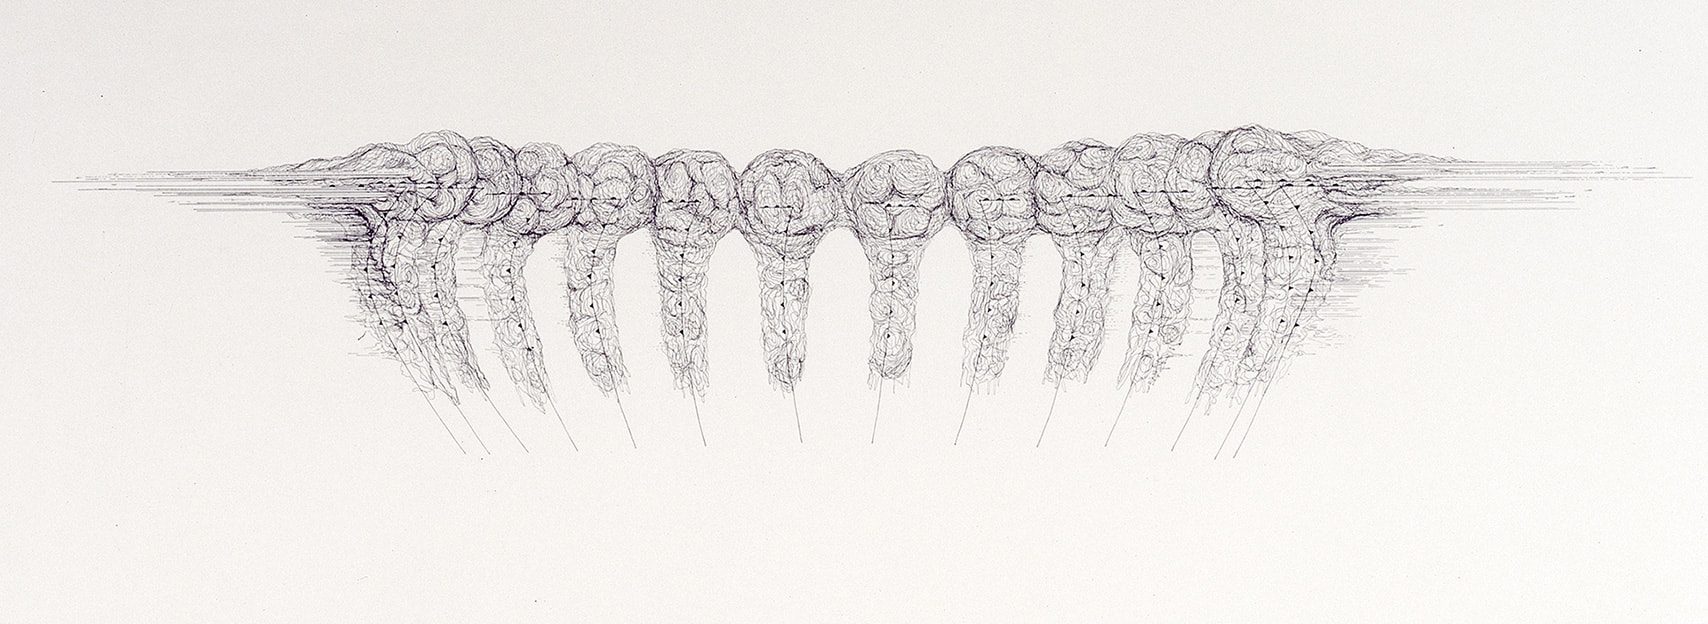
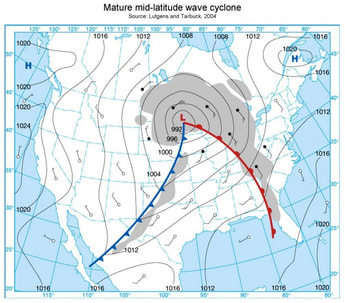
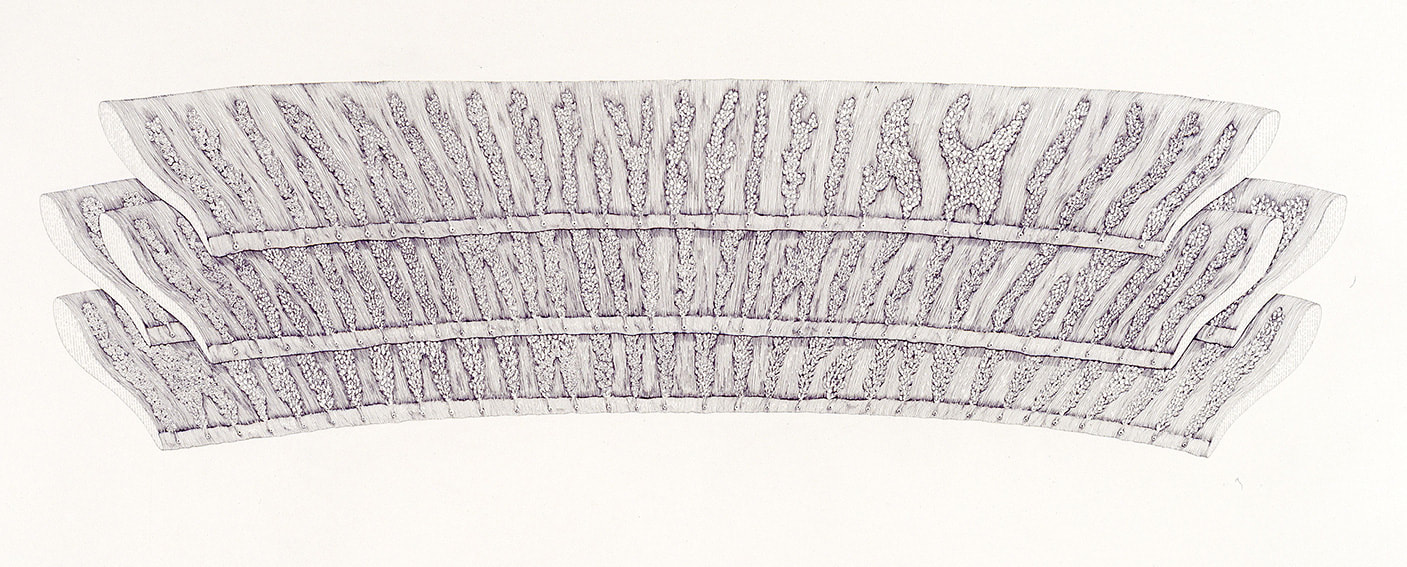
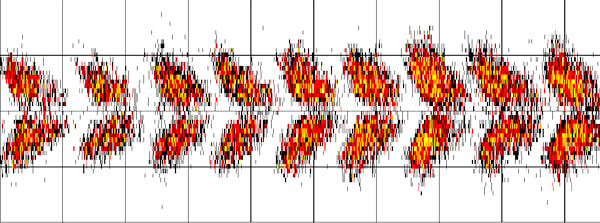
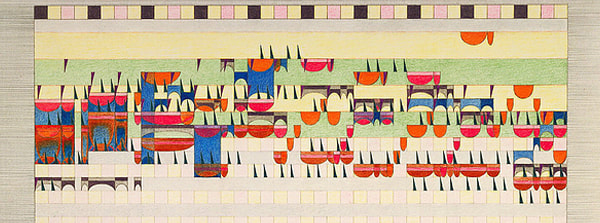
❉ Blog post 11 on diagrams in the arts and sciences examines a three-part drawing I made in 2007 titled 'Clouds, Glands, Tributaries'. This minimal, diagrammatic, meditation on water turned out to be a turning point in my artistic practice, bringing together my interest in encyclopaedias, diagrams, the sciences and romanticism for the first time. Image 1: Michael Whittle, Clouds, glands, tributaries, 2007, Ink on Paper, 133 x 125.5 cm 'Clouds, glands, tributaries' was drawn as part of a series of new works for the exhibition 'The Louder the Sun Blooms' held in New York, 2007. The title for the show was taken from the Dylan thomas Poem 'Poem on his Birthday', as the synesthetic image conjured by the words associate sound, heat, light and the unfurling of life with romantic notions of temporary beauty. The limitations of the human senses and of human thought are interests that connect not only the works in that particular exhibition, but the majority art that I've produced over the last 10 years. Other common themes include our attempts to classify and comprehend the world around us, taking into account our biological limitations, and, most importantly, the dissonance that arises from our division of existence in to the subjective inner world of experience and an objective outer world of physical reality. As an undergraduate student of Biochemistry, I was summoned by the head of the department to his office after our end of year examinations, where he cautioned me against my use of adjectives such as 'subtle', 'intricate' and 'profound' in an essay on molecular biology. Science, I was told, was like a game of cricket, which relies upon everyone playing by the same rules. Subjectivity, it turns out, was to be avoided at all costs in the context of a Biochemistry examination. Five years later at the Royal College of Art, the vice chancellor, himself a former Biochemist, described my entry for the 2003, RCA Christmas card competition as too 'cold', 'clinical' and 'objective', but decided to award it second prize anyway out of curiosity. It took a while to realise the deeper connection between these two seemingly unrelated events, but they were my earliest first hand experiences of the great divide between scientific objectivity and artistic subjectivity, and it wasn't until I created 'Clouds, glands, tributaries' in 2007, that I felt I had struck a balance between these two philosophical ideals, and possibly found a way to combine them. Over time I came to realise that the approach to creating drawing is almost identical to that writing of Japanese Haiku poetry. Unlike classical Chinese poetry, the Haiku poet must remain entirely objective whilst composing the three short lines of the poem. In a classic 'show, don't tell' fashion, if a poet makes the mistake of revealing their subjective feelings too directly then the poem fails as a haiku. To my mind the true power of a haiku lies in the 'subjective void' left by the poet for readers to fill themselves. As a result, the effect of a successful haiku is fleeting but powerfully subjective, and much more than the sum of its objective observations. The best haiku, even in translation, are capable of subjectively connecting reader and writer across vast distances in time, space, culture and language, despite the suppression of subjective expression in favour of objective depiction. Image 2: Clouds, glands, tributaries (detail 1) 14 cyclones rotating towards the viewer, drawn as weather diagrams Considered as a visual haiku, 'Clouds, glands, tributaries' consists of three tiers of objective, scientific diagrams that are connected abstractly through notions of water. The top level depicts several storm clouds in the ‘Comma cloud pattern’, otherwise known as ‘Mid-latitude cyclones’ in American meteorological terms. These particular clouds also reference a season, as haiku should, in that the majority of Mid-Latitude cyclones occur in the winter.
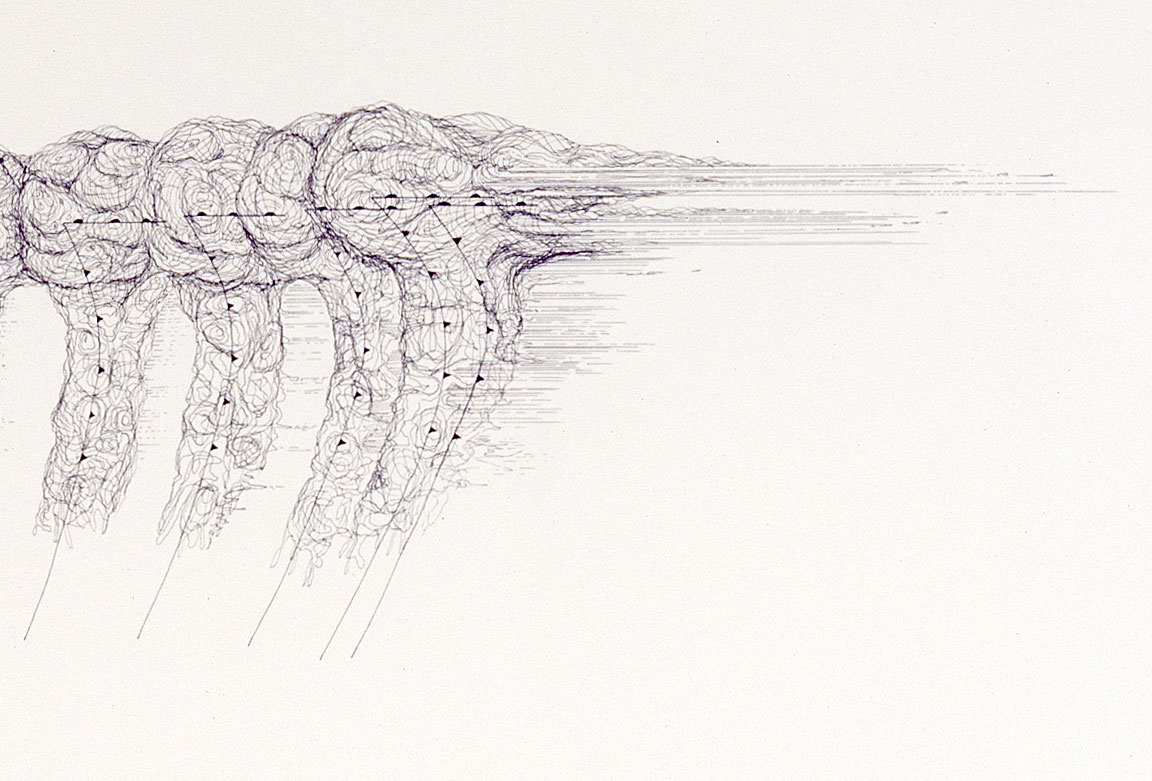
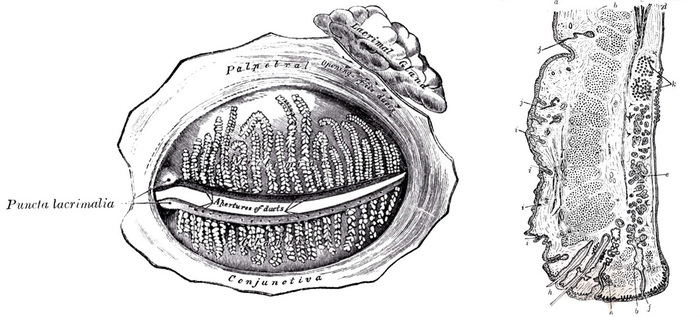
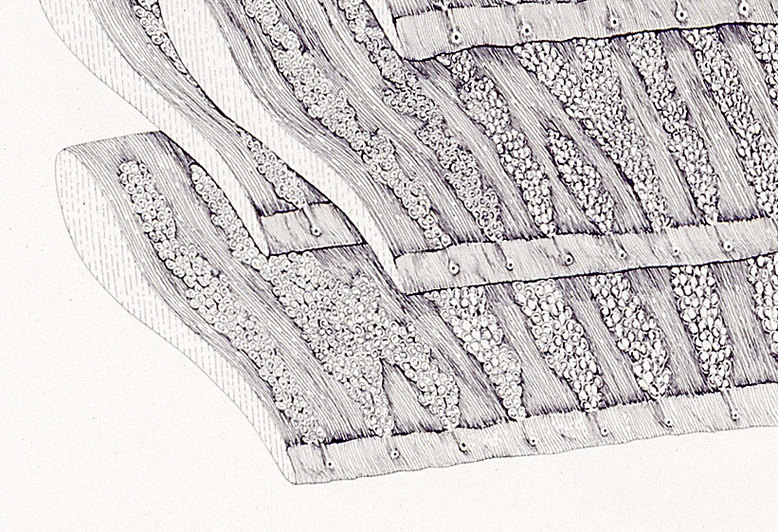
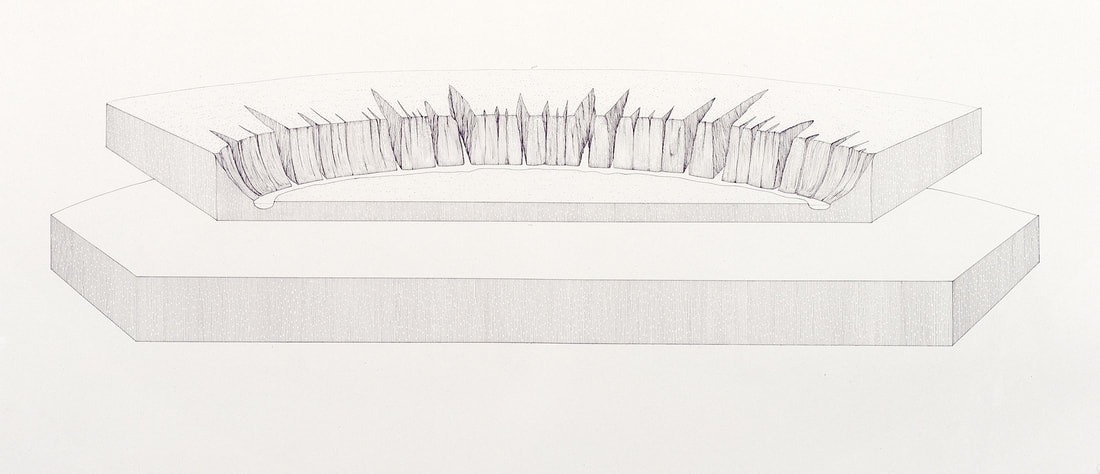
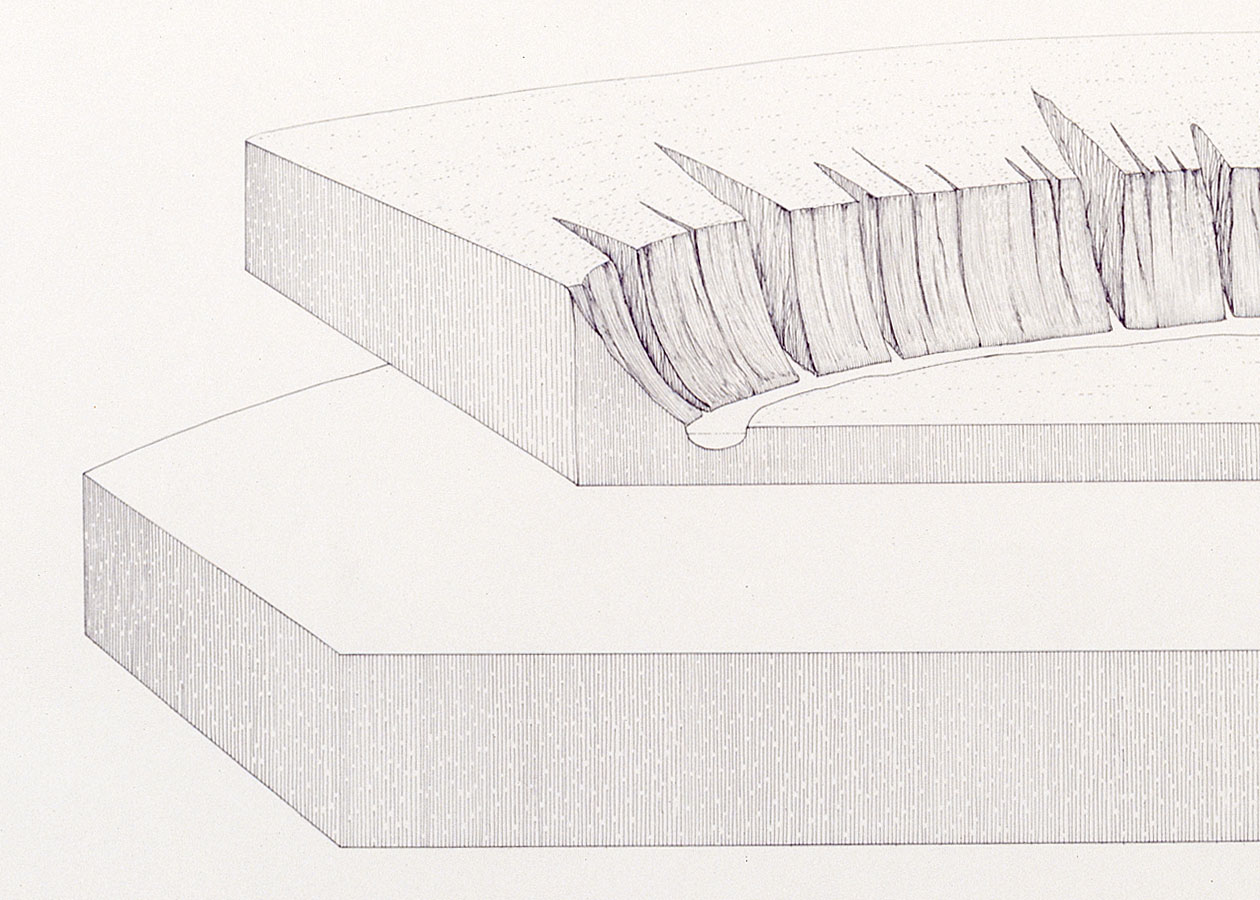
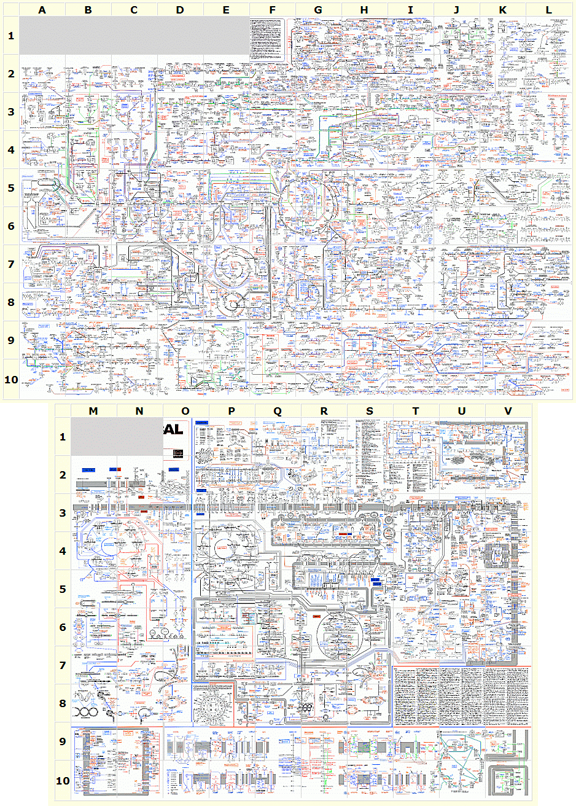
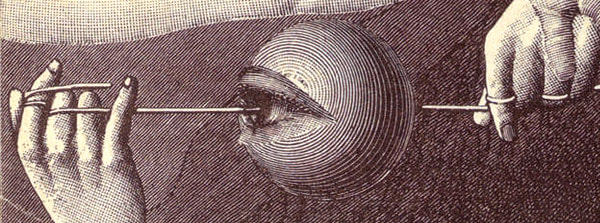
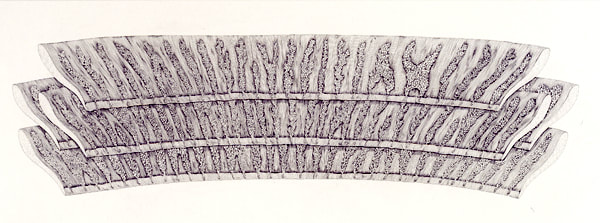
Image 4: Clouds, glands, tributaries (detail 2) Collision of cold front and warm front as part of the formation of a cyclone Beneath this layer, and on a very different scale, are drawn the Meibomian / Tarsal glands of the human inner eyelids. These specialised sebaceous glands secrete meibum along the rim of the eyelids inside the ‘tarsal plates’ (eyelids). Image 5: Clouds, glands, tributaries (detail 3) four inner eyelids complete with Meibomian (tarsal) glands Meibum is complex mixture of lipids that forms an oily layer trapping an aqueous layer of tears that coats the surface of the human eye. Composing the outer most layer of the 'precorneal film', meibum prevents the evaporation of tears as well as their spillage onto the cheeks, and create a delicate airtight seal when the lids are closed. Image 6: Medical diagram of the inner eyelids showing Meibomium (tarsal) glands and their ducts, and also the Lacrimal gland which creates tears. (frontal view and cross section) Image 6: Clouds, glands, tributaries (detail 4) Inner upper eyelids complete with meibomian (tarsal) glands and ducts In 'Clouds, glands, tributaries', four distinct superior tarsal plates (upper eyelids) are depicted overlapping one another, with the ducts of the glands pointing downwards towards a semi-circular river valley and floodplain beneath. Image 7: Clouds, glands, tributaries (detail 5) diagram depicting the theory of river tributary formation and flood plain This base layer shifts upwards in scale to depict two sheets of bedrock at the surface of the earth's crust. These geological cross sections show before (lower plate) and after (upper plate) images of erosion caused by both a river and the elements, to create various V-shaped valleys on the opposite bank to the floodplain. The drawings are based on the geological theory for the formation of river tributaries which suggests that over a period of geological time, small irregularities in the valley wall are eroded by running water to create fissures that gradually extend back into the surface of rock face into vast and complex river networks. Image 8: Clouds, glands, tributaries (detail 6) diagram depicting the theory of river tributary formation The three levels of the drawing 'Clouds, glands, tributaries' all indirectly reference water through a number of processes acting at different scales. The cyclonic clouds of water vapour are an emergent property of countless water droplets marshalled into an organised process by the collision of cold, dry air with warm, moist air, creating structures between 1500-5000 km in diameter, far larger than a hurricane or tropical storm. The Meibomian / Tarsal glands secrete an oil that traps the 'tear film' against the surface of the eye. This creates a miniscule layer of salt water 0.003 mm thick, through which we view the world. The geological layer beneath this depicts an erosion pattern arising as a result of water draining from the land into a river system. Two other aspects of water are present only by suggestion, the raindrops from the storm clouds and tears from the eyes, and both of these play off the idea of erosion over time on the landscape beneath. The spherical ball of an eye is also suggested by the spherical, negative space created by each of the three layers, in particular the four, overlapping, upper eyelids. To use Umberto Eco's terms, 'Clouds, glands, tributaries' is an open work in with no definitive reading. Like Marcel Duchamp's 'Large Glass' ('The Bride Stripped Bare by Her Bachelors, Even'), the title provides important clues but specific details remain hidden unless the viewer has some knowledge in meteorology, biology or geology. Duchamp proposed thought of a painting's title as "another colour on the artist’s palette", and his use of obscure references in 'The Large Glass' was accompanied by volumes of notes published both during his lifetime and afterwards as an encyclopaedic reference system to 'The Large Glass'. The disconnected and vague nature of the notes however only acts to add yet another layer of abstract meaning to be deciphered, as part of a cryptic game that has occupied a whole generation of Duchamp scholars. 'Clouds, glands, tributaries' relies upon specialised knowledge to recognise the specific nature of the diagrams being used as the title gives no suggestion as to what type of cloud, gland or tributary the viewer is looking at, so that the references risk being lost in ambiguity. In order to avoid this problem the titles of later works employ more specific scientific terminology, to act as a set of keys to access the concepts being referred to. Instead of having to refer to volumes of notes to read each drawing however, an inquisitive viewer can check the terms used in a title using their smartphone, and in this way each person can develop their own reading of a work and draw their own conclusions, thanks to the ever increasing intelligence of search engines, and the vast, interconnected hypertext of the internet. To see just how subtle, intricate and profound biochemical pathways really are, it's worth following the link below to two of my favourite diagrams of all times. Compiled by Gerhard Michal of the Boehringer Mannheim company, they were originally published as huge wall posters, but are now available for free in an online, interactive form. The two charts 'Biochemical Pathways' and 'Cellular and Molecular Processes', are both daunting in their scale and beauty, but it's worth remembering that if every known molecule within the human cell were to be included on a chart at this scale, it would need to be far larger than a football pitch in size (and probably 3-D). Click on the images below to access the online versions of the charts:
0 Comments
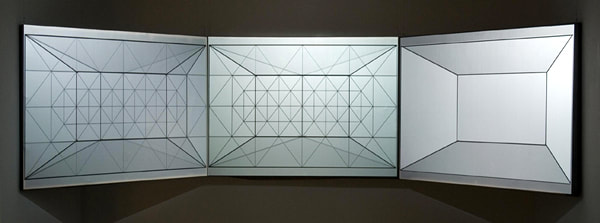
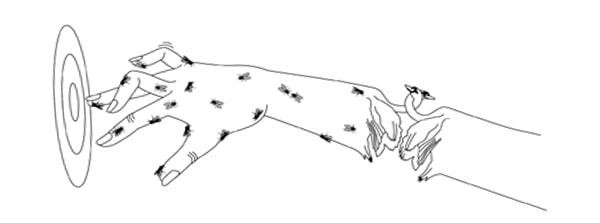
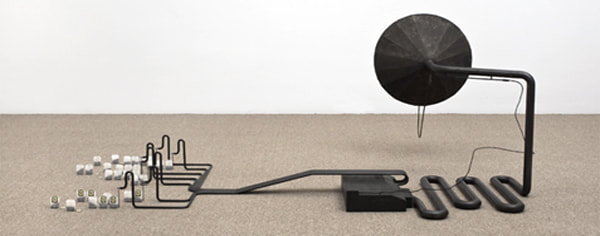
❉ This is the tenth in a series of blogs that discuss diagrams and the diagrammatic format, especially in relation to fine art and the sciences. I recently completed my PhD on this subject at Kyoto city University of the Arts, Japan's oldest Art School. Feel free to leave comments or to contact me directly if you'd like any more information on life as an artist in Japan, what a PhD in Fine Art involves, applying for the Japanese Government Monbusho Scholarship program (MEXT), or to talk about diagrams and diagrammatic art in general. Figures 1, 2: Yves Netzhammer, digital drawings, 2010 The working process of Swiss artist Yves Netzhammer begins with what he calls his 'stockpile of conjectures'. This is a growing body of diagrammatic sketches that compose his process of visual thinking, and act as source material for further development into finished drawings, animations, sculptures and installations. Netzhammer's use of computer illustration and 3D modeling programs is a means of distancing the hand of the artist from his artworks, and imbues his work with a concise and highly distinctive aesthetic of economised line, form, colour and movement. In this way, the diagrams, models and video works of Netzhammer embody the characteristics of what Duchamp called "paintings of precision", imagery purified of irregularities and presented in an airless, ideal realm. Figure 3: Yves Netzhammer, Untitled, Seilzeichnung, 2011, Rope, metal, wood, glass and colour, variable dimensions 'Seilzeichnung' (rope-drawing), was the first art work I saw by Netzhammer in Gwangju, South Korea, in 2011. Part wall-drawing, part sculpture, the focal point of the work is the diagrammatic depiction of a dog biting a human wrist, with the dotted bone of the forearm visible between the dog's teeth. The fingers of hand hold a swab with which an anonymous person appears to be taking a clinical sample from the back of the dog's tongue.
Certain elements of Netzhammer's work are common to other diagrammatic artists such as Mark Mander’s use of cross section, artificial architectural constructs, interconnected forms and lines which divide, connect, and often bind objects and ideas together. You can read more about Mander's work in a previous blog here: Portrait of the artist as a building. Netzhammer first studied architecture and received training in architectural draughting. This is an important point, because of the strong theoretical and practical presence of the diagram within the field since the 1980's. Netzhammer later enrolled at Zurich’s Hochschule für Gestaltung und Kunst, where he attended the figurative arts course. The human form in Netzhammer's work is depicted in a way that highlights its own artificiality. His figures resemble the featureless models used in art school life drawing class, crash test dummies and shop display mannequins. These are presented in spaces constructed in the idealised, neutral style of the computer-aided design programs of architectural modeling. A stark, single light source also helps direct the viewer's attention to the objective, artificiality of this system of visualisation. Below is a series of video extracts that help give a clearer example of how Netzhammer uses the diagrammatic format to create a distinctive, objective visual language which he then applies to emotive, subjective themes in a way that I describe as Romantic Objective. The clips were compiled by the artist himself from an exhibition at Bremen Art Museum in 2006: 'Die Anordungsweise zweier Gegenteil, bei der Erzeugung ihres beruhrungsmaximums' (The arrangement of two opposites while their maximum point of contact is under generation). Figure 6: Yves Netzhammer, The Arrangement of Two Opposites While Their Maximum Contact Is Under Generation 2005, Kunsthalle Bremen, Germany I contacted Netzhammer in 2013 as part of my PhD research into the importance of the diagram in contemporary art. I wanted to ask about the role the diagram plays in his own drawings, installations and video works, and why he opted to work with diagrammatic imagery. He explained that: " It started, in my case, in looking for another way to show a new form of subjectivity. I positioned the computer between me and my thoughts/wishes. I guess, I prefer the diagrammatic “style”, because I’m really trying to find “something” (connected to philosophical questions). Not in the common scientific sense of discovery, but something which appears close to our questions about identity. I hope that an artistic approach to forms of empathy can generate such results, especially, when it comes in a paradoxical format like drawings, which stands in the tradition of explanation. " A full transcript of Netzhammer's answers and other interviews with diagrammatic artists can be found on the research page of this website. Below are a series of video clips of Netzhammer's various projects. More information can be found at the artist's own website: http://netzhammer.com/ and also the online journal: http://www.journalfuerkunstsexundmathematik.ch/ |
Dr. Michael WhittleBritish artist and Posts:
Categories
All
Archives
April 2024
|
