|
❉ Blog post 13 on diagrams in the arts and sciences explores Mathematic's love/hate relationship with diagrams, and May Ray's favourite 'Shakespearean equations'. Max Ernst, 'Spies', Plate 10, cover illustration for Paul Eluard's book of poetry 'Repetitions', published 1922 " A mathematician, however great, without the help of a good drawing, is not only half a mathematician, but also a man without eyes. " Lodovico Cigoli to Galileo Galilei, 1611 Diagrams hold an important but controversial position in Mathematics, particularly within the field of geometry, where they are primarily regarded as a method of enhancing comprehension of a proof rather than partaking in rigorous mathematical reasoning. A number of simple, cautionary examples of the problematic relationship between Maths and diagrams exist as diagrammatic puzzles, and a famous example is the 'Missing Square Puzzle' shown in figure 1.
The natural limits to the acuity of human vision affects the way that we make estimations about the shapes of triangle A and B, and whether or not their lines are straight. The diagram in Figure 2 reveals that objects A and B are actually 4-sided quadrangles, rather than triangles. Neither of their hypotenuse (the longest side of the triangle ) of are straight lines. Figure 2: Graph of two false Hypotenuse for triangle A and B, neither of which are truly straight. If we return to look again at figure 1, the small difference in the angle of slope of the blue and red components is indistinguishable, especially when spread across a distance. However in reality, their difference totals one unit of area, and this explains the seemingly miraculous origins of the missing square. Marcel Duchamp was fascinated by the idea of a parallel world of Mathematical perfection that exists alongside the chaos and imperfection of reality and daily experience. This was the subject of the blog post: 'A soggy book of diagrams as a wedding present from Marcel Duchamp', which considered one of Duchamp's less well known projects using a found book of Euclid's Geometry.
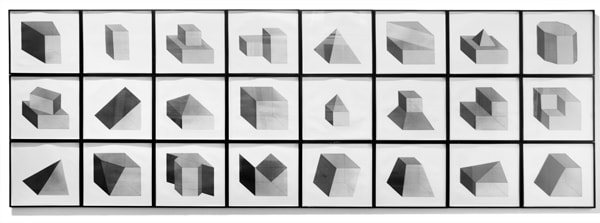
The quote I used to introduce this blog is taken from a letter written by the Italian artist Lodovico Cigoli to his lifelong friend the scientist Galileo Galilei. (1) Both men shared a passion for art and science. Galileo's interest in art is the subject of an extensive study by Erwin Panofsky, in his 1954 book 'Galileo as a Critic of the Arts'. Cigoli was interested in mathematics, science, geometry, and wrote an extensive treatise on perspective. For Lodovico Cigoli, a good 17th century diagram provided a visual means of gaining a deeper insight into the mathematics of nature. However, over the course of the following two centuries, the role of the diagram shifted to the extent that it became considered more of a veil that obscured the essence of mathematics, and algebra was proposed as the only way to lift the veil. Writing in the early 18th century, in a statement that anticipates the predominate modern view, the philosopher and mathematician Leibniz asserted that: "...it is not the figures which furnish the proof with geometers, though the style of the exposition may make you think so. The force of the demonstration is independent of the figure drawn, which is drawn only to facilitate the knowledge of our meaning, and to fix the attention; it is the universal propositions, i.e., the definitions, axioms, and theorems already demonstrated, which make the reasoning, and which would sustain it though the figure were not there." (2) Figure 4: Diagrams submitted to accompany solutions describing the shape of a Catenary curve, by Gottfried Leibniz (Figure 1 left) and Christiaan Huygens (figure 2 right) to Jacob Bernoulli for publication in the Acta Eruditorum, 1691 It's important to bear in mind our visual limitations and the way our brain makes approximations when reading the diagrams of mathematics. This and the fact that real-world diagrams of perfect mathematical objects ultimately rely upon imperfect lines of ink, chalk or pixels. However, the diagram remains an extremely powerful tool and a visual guide in providing an insight into the austere and pristine world mathematical geometry and topology. Leibniz's own notebooks contain an astounding array of diagrammatic sketches that accompany his mathematics, as in figure 4, and the designs and calculations for his 'Universal Calculator', some 200 years before the work of Charles Babbage. For an interesting introduction to the notebooks of Leibniz, see Stephen Wolfram's blog: Dropping In on Gottfried Leibniz. For centuries mathematicians have constructed 3D diagrammatic models to illustrate mathematical concepts to students. A famous collection of these models is housed at the Institut Henri Poincaré in Paris. Between 1934 and 36, the American artist Man Ray made several visits to the Institut to photograph the collection, accompanied by Max Ernst. The Greek art critic and publisher Christian Zervos used the photographs for an article in the Parisian Cashiers d'art, and the images quickly became famous in Surrealist circles. Man Ray described the models that he found languishing in dusty cabinets as 'so unusual, as revolutionary as anything that is being done today in painting or in sculpture', though he admitted that he understood nothing of their mathematical nature. When the Second World War came to Paris in 1940, Man Ray relocated to Hollywood, where he started work on a series of 'suggestively erotic paintings' based on his 1930's photographs. Under the title of the 'Shakespearean Equations', he later referred to the paintings as one of the pinnacles of his creative vision. Below are images of selected paintings from the 'Shakespearean Equations' series, Juxtaposed alongside the original mathematical models they were based upon. Note: An extensive online collection of mathematical models is available here: the Schilling Catalogue of Mathematical models Figure 5: Selection of paintings from Man Ray's 1940's 'Shakespearean Equations' series, shown alongside the models they were based on, from the Institut Henri Poincaré, Paris. An important and influential book on Mathematical diagrams was Eugene Jahnke and Fritz Emde’s 'Funktionentafeln Mit Formeln und Kurven' (Tables of functions with formulae and curves). This landmark publication on complex mathematical surfaces and functions was first published in 1909, and a selection of graphs taken from the 1933 edition of the book are shown below, courtesy of Andrew Witt. As Witt points out in his own blog on this series here: Functional Surfaces I, it's said that the architect Le Corbusier kept a copy in his studio whilst designing the Phillips Pavilion. Max Ernst appropriated from the book for a series of collages and poems in the catalogue accompanying his 1949 exhibition 'Paramyths'.
Figure 8: A selection of diagrams from the 1933 edition of 'Funktionentafeln Mit Formeln und Kurven', by Eugene Jahnke and Fritz Emde, courtesy of Andrew Witt. AFTERWORD:
Jos Leys, Dodecahedral Tessellation of the Hypersphere: a dissection of the 120-cell in 12 rings of 10 dodecahedrons References:
1) Some 29 letters from Cigoli to Galileo remain, however only 2 letters from the scientist to the painter are left, as the artist's heirs chose to destroy all incriminating evidence of their association, after the papal condemnation of Galileo. (In 1610 Cigoli received from Pope Paul V the assignment to paint the dome of Santa Maggiore Maggiore with the Immaculate Conception, the Apostles and Saints.) 2) Leibniz1704, New Essays: 403
3 Comments
|
Dr. Michael WhittleBritish artist and Posts:
Categories
All
Archives
April 2024
|


