Diagrams from the dark ages: glimpses in to the workings of the medieval mind.
- jmfwhittle
- Jun 10, 2016
- 8 min read
❉ This is the sixth in a series of blogs that discuss diagrams in the arts and sciences. I recently completed my PhD on this subject at Kyoto city University of the Arts, Japan's oldest Art School.
Feel free to leave comments or to contact me directly if you'd like any more information on life as an artist in Japan, what a PhD in Fine Art involves, applying for the Japanese Government Monbusho Scholarship program (MEXT), or to talk about diagrams and diagrammatic art in general.

Figure 1: Opicinus de Canistris (1296–ca. 1354), Diagram with Crucifixion,
Avignon, France; 1335–50, Biblioteca Apostolica Vaticana, Vatican City, Pal. Lat. 1993
Far from being a period of intellectual stagnation, the Middle Ages was a time of vibrant visual thinking, and the diagram was its essential tool. Medieval thinkers and artists used this versatile format to map every conceivable aspect of existence, from the cosmic and divine to the deeply personal and practical. This impulse to chart the unseen resulted in a stunning variety of forms, each designed to make the abstract tangible and to reveal the hidden connections that ordered the universe.
This quest to connect the microcosm of the human experience to the macrocosm of the divine order is visible everywhere. We see it in the Zodiac Man, which mapped the celestial bodies onto the human form, and in scholastic diagrams of the mind, which sought to chart the internal architecture of the soul itself.
But diagrams were not only for metaphysical speculation; they were also practical tools for navigating the moral, social, and even sonic landscapes of the era. The Tree of Virtues and Vices offered a visual roadmap to salvation, diagrams of Consanguinity provided a logical system for enforcing canon law, and the ingenious Guidonian Hand transformed the body into an interactive textbook for teaching music.
By first exploring this diverse landscape of visual tools, we can then turn our focus to the work of a single figure who pushed these traditions to their breaking point: the Italian cleric Opicinus de Canistris. His drawings are not static images but dynamic, rhizomatic systems of thought—each one a convoluted network of overlapping layers and hidden connections, a universe of interconnected information that offers a unique and unforgettable glimpse into the medieval mind.
Mapping the Inner World: The Architecture of the Soul
While many medieval diagrams charted the external macrocosm—the cosmos and the continents—others sought to map an equally complex internal world: the mind itself. Influenced by classical and Islamic thought, scholastic thinkers used diagrams to schematize the soul's architecture and the process of perception. These were not anatomical charts but philosophical tools, designed to illustrate a divinely ordered cognitive process.

Figure 2: Unknown artist, The internal and external senses from St Augustine,
De spiritu et anima (Trinity College Cambridge MS O.7.16 fol 47)
A common model, found in manuscripts like St. Augustine's De spiritu et anima, depicted the brain as a series of ventricles, each with a distinct faculty. Drawing on the work of the Persian physician Avicenna, these diagrams typically showed how sensory information entered through the five external senses, was processed by "Common sense" and "Imagination" in the forward ventricles, passed to "Judgment" or "Image creation" in the middle, and was finally stored in "Memory" in the posterior ventricle. By arranging these abstract faculties into a physical space, the diagram transformed the unseen process of thought into a comprehensible, ordered system.
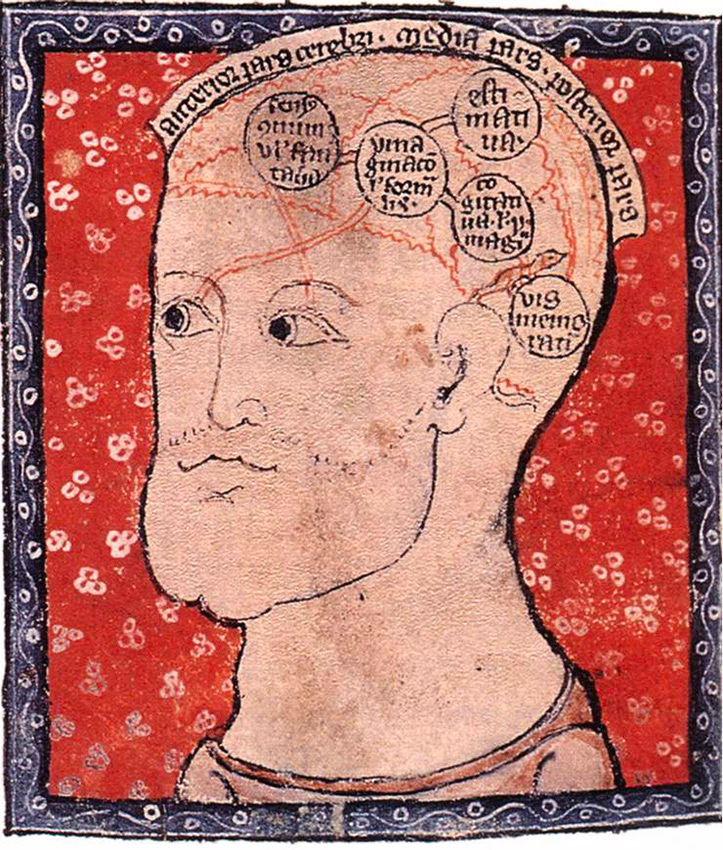
Figure 3: Unknown artist, Diagram of the brain, circa 1300.
University Library at Cambridge University
(Avicenna's five ventricles: Common sense, Imagination,
Judgment, Image creation and Memory.)
The Zodiac Man: Charting the Celestial Body
Perhaps the most iconic and artistically sophisticated version of the medieval Zodiac Man is found in the Très Riches Heures du Duc de Berry, a magnificent manuscript created between 1412 and 1416. While many such diagrams exist, this version, created by the Limbourg brothers for their immensely wealthy patron, represents the pinnacle of the International Gothic style. The figure is not merely a chart but a work of art, elegantly rendered within a celestial mandorla and surrounded by the rich colors and gold leaf that only the most elite patrons could afford.

Figure 4: Limburg Brothers, Anatomical Man, 1411-16, Tempera on vellum
29 x 21 cm. In: Très Riches Heures du duc de Berry
Like all such diagrams, it is a powerful visualization of the microcosm/macrocosm worldview, mapping the twelve signs of the zodiac onto the specific parts of the body they were believed to govern. It was a practical tool for medical astrology, consulted to determine the most auspicious times for surgery or bloodletting based on the moon's position. However, this specific example transcends its function as a mere chart. It is the ultimate expression of the belief that the human body was a small-scale mirror of the celestial order, rendered with a level of artistry and sophistication that transforms a common didactic tool into a masterpiece of late medieval thought.
The Tree of Virtues and Vices: A Roadmap to Salvation
To make abstract moral theology tangible, medieval thinkers developed didactic diagrams like the Tree of Virtues and Vices. These illustrations used the intuitive metaphor of a tree to map the complex relationships between ethical concepts.
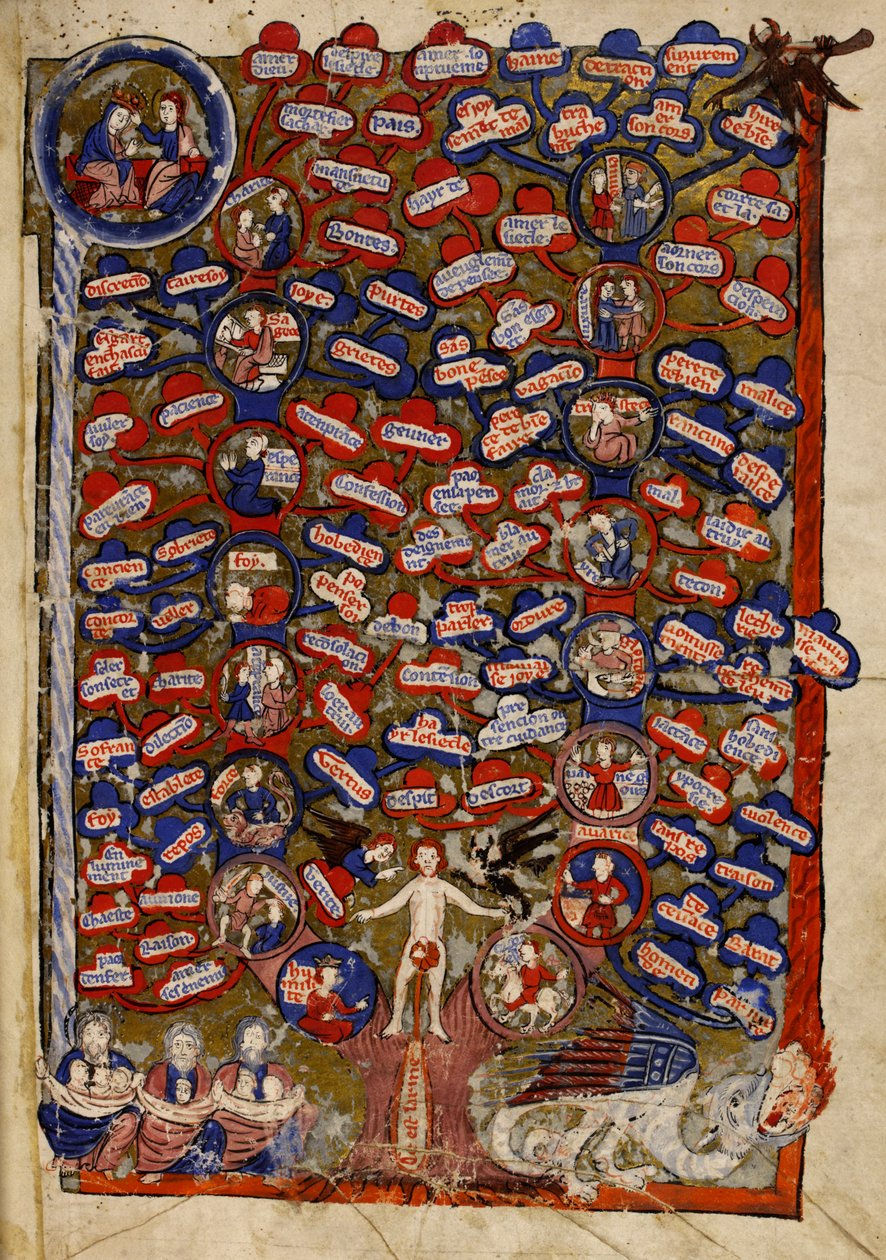
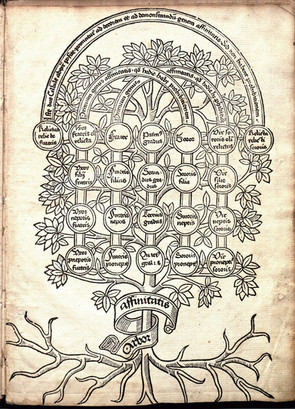
Figure 5: The Tree of Virtues and Vices, from 'Li Livres dou Tresor', by Brunetto Latini,
c. 1266, Ink, colour and gold on vellum
Typically, a central trunk would represent a core virtue (like humility) or a deadly sin (like pride), with the branches showing the good or evil actions and qualities that grew from that root. This format served as a powerful mnemonic device for monks, clerics, and laypeople, transforming the path to salvation into a visual roadmap of moral choices and their consequences.
Consanguinity Diagrams: The Logic of Law and Lineage
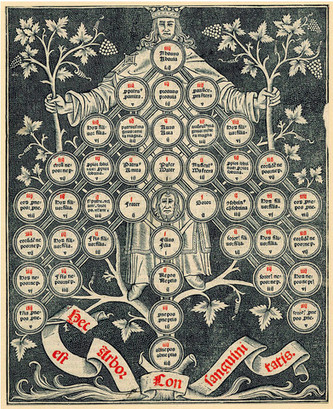
Not all medieval diagrams were metaphysical; many served highly practical, legalistic purposes. The foundational model for this tradition comes from Isidore of Seville’s Etymologiae, a work so essential that it was arguably the most influential book after the Bible in the learned world of the Latin West for nearly a thousand years. (1)

Figure 6: St Isidore of Seville, Etymologiae, c 7th Century
In: Augsburg, Günther Zainer, Printed 19 November 1472.
Contained within this monumental text was the standard diagram of consanguinity (blood relations), which became an essential tool in canon law. Structured like abstract family trees, these charts visually calculated the "degrees" of kinship between individuals.
Their primary function was to enforce the church's complex incest prohibitions by determining who was too closely related to be granted a license to marry. These diagrams demonstrate a different side of medieval thought: the need for systematic, logical tools to regulate social order, with a lineage stretching back to one of the period's most important texts.
The Guidonian Hand: Music Made Manifest
One of the most ingenious mnemonic diagrams ever conceived is the Guidonian Hand, a tool used for centuries to teach music. It was developed in the early 11th century by the monk Guido of Arezzo, who sought a way to help his fellow monks learn to sight-sing with greater ease.

Figure 7: Guido d'Arezzo, Guidonian Hand, c. 990-1050
Guido first derived the solfège method, assigning a syllable to each note of a six-note scale (ut, re, mi, fa, sol, la). The Guidonian Hand then elaborated on this system, creating a diagram that assigned each of these notes to a specific joint or tip of the human hand.
This allowed a choir master to simply point to a part of his own hand to signal a pitch, which the singers would respond to instantly. It is a brilliant example of embodied knowledge, turning the body itself into an interactive textbook and making the abstract system of musical notation a physical, unforgettable reality.
The Divine Cartography of Opicinus de Canistris
Among the most profoundly creative diagram-makers of the period was the Italian cleric Opicinus de Canistris (1296–ca. 1354). The fluid nature of the diagrammatic format allowed him to overlay maps, figures, and symbols, creating labyrinthine hybrid schemes of varying transparency and opaqueness. The results are a disorientating mixture of factual accuracy, fanciful creativity, and divine revelation that pushes interpretation to its limits.
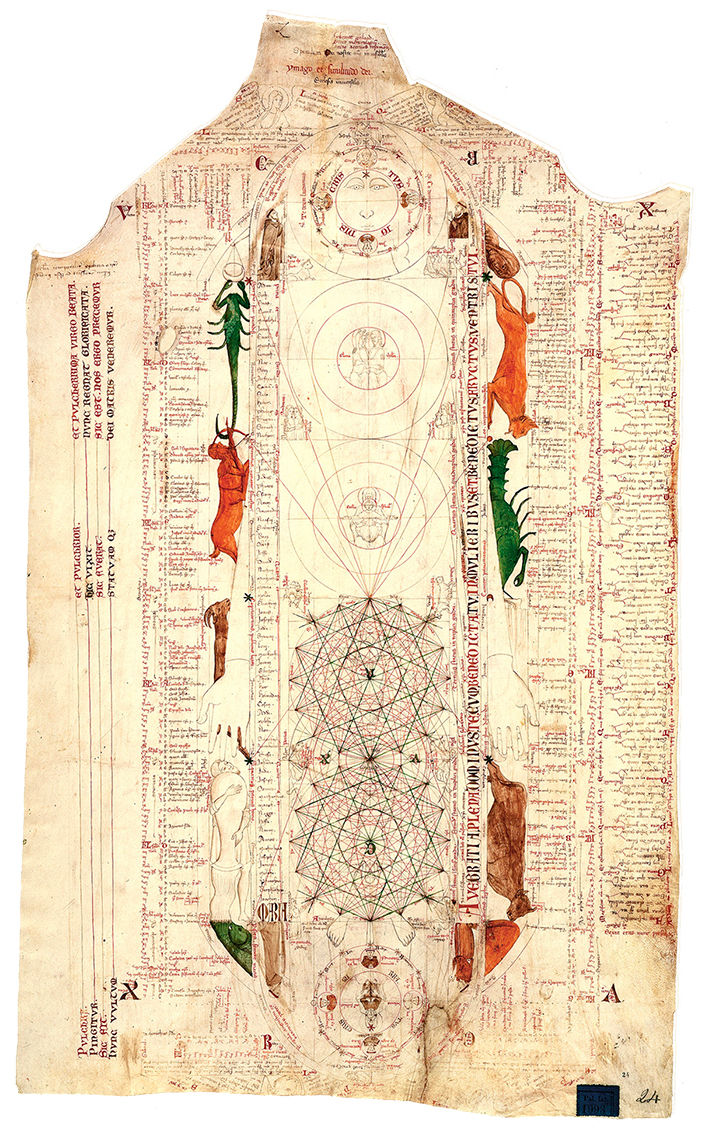
Figure 8: Opicinus de Canistris (1296–ca. 1354) Diagram with Zodiac Symbols, folio 24r
Avignon, France, 1335–50 Biblioteca Apostolica Vaticana, Vatican City, Pal. Lat. 1993
What sets the cleric’s work apart is his combination of empirical objectivity with creative subjectivity. Opicinus integrated some of the most technically accomplished cartography of his day—mariners’ sea-charts known as portolan charts—into his work. This provided an empirical foundation for his visionary project, but his goal was not geographical accuracy.
The large parchment 'Diagram with Zodiac Symbols' is Opicinus' densest surviving composition, containing over twenty different sets of information: the major prophets, minor prophets, planets, two different sets of zodiac symbols, the doctors of the Church, four monastic orders and their founders, months, days, an implied world map, the genealogy of Mary, the Ave Maria, three personifications of the church, two crucifixions, the gifts of the Holy Spirit, the four types of Biblical exegesis, the four Evangelists, the apostles, and the names of the letters of Paul. (2)
For Opicinus, this was a form of divine cartography, mapping the hidden spiritual logic of the universe. By layering theological imagery onto real-world maps, he created a completely new type of representation. This makes his work one of the earliest examples of what I refer to in my research as "Romantic-Objective" art. As Karl Whittington proposes, "his drawings anticipate the concept of man as the measure of all things." (3)


Figures 9-10: The divine visions of Opicinus De Canistris, 14th Century
There is evidence that Opicinus suffered a stroke-like event in 1334, after which he became paralyzed and mute but experienced powerful divine visions of continents and oceans transformed into human figures. These surreal, almost hallucinatory images are among his most fantastical works. His visual statements were closely connected to his own spiritual rebirth.
In one famous image, he depicts Europe as the body of Christ and identifies with its circumcised penis, naming it "Opicinus, minister of the church". In doing so, he visualizes the church’s role as the dissemination of God’s word—spreading the seed of faith. This explicit and personal free play with concepts of sex and self is highly unusual in a medieval context and makes his work a unique piece of our shared heritage.

Figure 11: Opicinus De Canistric, The seed of faith, c. 1330.
Conclusion
As these examples show, the medieval diagram was a dynamic tool for thought, capable of ordering everything from moral law to the human mind and from musical scales to marriage rites. The visionary work of Opicinus de Canistris reveals the outer limits of this practice, where personal revelation and empirical data collide in a search for divine meaning.
The gallery below offers further glimpses into this rich visual world, showcasing the fundamental role diagrams have always played in shaping how we see reality.
Gallery:


References:
1) Stephen A. Barney, ed. The Etymologies of Isidore of Seville, 2006; Corin Braga, "Marvelous India in Medieval European Representations", Rupkatha Journal, Vol. VII, No. 2, 2015; Valerie Flint, The Imaginative Landscape of Christopher Columbus, pp. 139 & 173.
2) Holcomb, M. and Bessette, L. (2009) Pen and Parchment: Drawing in the Middle Ages. New York: Metropolitan Museum of Art, (2009, Yale University Press), p.154
3) Whittington, K.P. (2009) Opicinus de Canistris, Vatican Library Pal. Lat. folios2v, 20r, 24r. In: Holcomb, M. and Bessette, L. (Eds) Pen and parchment: drawing in the middle ages. The Metropolitan Museum of Art (2009, Yale University Press), p.148-55.


Comments