Meta-engines of creativity: diagrams in Physics
- jmfwhittle
- Nov 20, 2017
- 8 min read
❉ Blog post 14 on diagrams in the arts and sciences considers the role of diagrams in theoretical and particle physics, as powerful conceptual tools to gain unexpected insights in to the fundamental nature of reality.

Figure 1: Lecture scene from the Coen Brother's Academy Award winning film 'A serious Man', 2009.
The previous blog looked at some of the difficulties involved in diagramming ideal geometric forms in mathematics, and how the natural limits to human vision affects the accuracy of their interpretation. Despite such shortcomings, diagrams still play an extraordinary variety of roles at the frontiers of mathematical knowledge production, where they help fathom some of the most complex patterns the human minds is capable of comprehending.
Mathematician, astronomer and physicist C.F. Gauss famously asserted that: "Mathematics is the Queen of the Sciences... She often condescends to render service to... other natural sciences, but under all circumstances the first place is her due." (1)
This notion of mathematics in service to science is most discernible in the intimate relationship between maths and physics. In the introduction to Eric Temple Bell's book 'Mathematics - Queen and Servant of Science', titled in reference to Gauss, we're reminded how important advances in pure mathematics have sometimes found application many years after the initial discoveries were made. Without the non-Euclidean Geometry that Riemann developed in 1854, for example, Einstein would have been unable to state his theory of General Relativity and Gravitation in 1916.
While mathematics may still retains a position of sovereignty within contemporary science, the relationship is no longer so one sided. Research in contemporary physics has developed such a rich and sophisticated mathematical language of its own that it's quite capable of inspiring insights within the field of mathematics itself. The sheer complexity of the calculations involved in string theory for example, lead physics titan Edward Witten to describe them as a bit of 21st century physics that somehow dropped into the 20th century. Witten's own work in string theory was revolutionary and led Witten to mathematical results so profound that he become the first physicist to be awarded the Fields medal for mathematics in 1990.
With this in mind, this blog entry considers some of the most profound, mysterious and powerful diagram in physics, diagrams which seem to transcend their mathematical origins and function at meta-levels in terms of their efficiency and the value of their insights.
The Genius and His Doodles

Figure 2: Richard Feynman with his family in front of his 1974 Dodge Tradesman van,
which he decorated with hand painted Feynman diagrams.
The first and most iconic example of such diagrams is the Feynman diagram, named after the American physicist Richard Feynman (1918-88). Feynman was the eccentric 'genius's genius' with a legendary reputation for creative problem solving and the ability to teach the complexities of quantum physics to students and non-physicists.
Feynman first created his diagrams as mnemonic doodles to keep track of the long and complex calculations of QED, or Quantum Electrodynamics, the study of electromagnetism at the quantum-mechanical level. However he quickly realised they could be developed into a method of organising calculations with such efficiency that they avoid having to write out sheets of dense mathematical notation.
Feynman diagrams are powerful tools because they provide a transparent picture for particle interactions in spacetime. They usually represent sub-atomic events in two dimensions: space on the horizontal axis and time on the vertical axis (figure 3).

Figure 2: Early Feynman diagram depicting
electron-electron scattering
Straight lines represent fermions, such as electrons, and wavy lines represent bosons, such as photons (except for the Higgs boson which uses a dashed line, and gluons which use loops).
The points where one line connects to another is known as a vertex, and this is where the particles meet and interact: by emitting or absorbing new particles, deflecting one another, or changing type.
Figure 3 shows one of the earliest published Feynman diagrams (Sightings, Sept. 2003) depicting electron-electron scattering by means of a virtual photon (labelled here as virtual quantum and depicted as a wavy line). The diagram presents a quantum-mechanical view of how particles with like charge repel one another.
Feynman diagrams are powerful tools because they provide a transparent picture for particle interactions in ¬space¬time. They usually represent sub-atomic events in two dimensions: space on the horizontal axis and time on the vertical axis (figure 3). Straight lines represent fermions, such as electrons, and wavy lines represent bosons, such as photons (except for the Higgs boson which uses a dashed line, and gluons which use loops).
The points where one line connects to another is known as a vertex, and this is where the particles meet and interact: by emitting or absorbing new particles, deflecting one another, or changing type. The Feynman diagram in figure 3 sketches out a map of the mathematical expression:
$e^2 \int\int d^4 x 5 d^4 x 6 K +(3,5)K +(4,6) \ gamma \ mu \ delta
+ (s {56}^2) \ gamma \mu K +(5,1)K +(6,2)$
In it's simplest interpretation two electrons interact, trade a virtual photon and then scatter as a result of their interaction.
Picturing Uncertainty
The visual clarity and precision of feynman diagrams belies the quantum uncertainty of the subatomic collisions and scatterings events they depict. Unlike a bubble chamber image, only the sum of all the Feynman diagrams represent any given particle interaction; particles do not opt for a one diagram or another each time they interact. At the quantum level particles interact in every way available to them, and so an exact description of the scattering process involves summing up a large number of diagrams, each with their own mathematical formula for the likelihood they will occur.
In this way a single Feynman diagram represents all possibilities of an interaction from its initial to final state, and so the connections of a Feynman diagram are more important than the configuration of it's lines, squiggles, loops and dashes. Pioneer of data visualization and expert on information graphics Edward Tufte, had 120 Feynman diagrams constructed in stainless steel (see figure 4). His wall mounted constructs represent all 120 different ways that a 6-photon scattering event can be depicted.

Figure 4: All possible 6-photon scattering (120 space-time Feynman diagrams), 2012, Edward Tufte, Wall mounted installation of stainless steel with shadows, 530 x 230 x 10 cm (Installation view at Fermilab)

Figure 5: Figure 4: All possible 6-photon scattering (detail)
The Limits of a Legacy
Feynman introduced his ingenious schematic in 1948, but by the 1980's their limitations were starting to become apparent, and Feynman himself went on to prove that the diagrams were only approximations that involved an enormous amount of redundancy that arose from their reliance on involving virtual particles (see figure 2).
Feynman diagrams were designed to describe all the possible results of subatomic particle collisions, but even a seemingly simple event like two gluons colliding to produce four less energetic gluons, involves some 220 diagrams. Such collisions occur billions of times a second during experiments carried out using modern day particle accelerators.
In the mid-2000s patterns began to emerge from events recorded in particle accelerators that repeatedly hinted at an unknown, underlying, coherent mathematical structure. A new set of formulas were proposed by the physicists Ruth Britto, Freddy Cachazo, Bo Feng and Edward Witten, known as the BCFW recursion relations after their discoverers. The formulas dispense with familiar variables of Feynman diagrams such as position and time, and involves an entirely new diagrammatic system first developed in the 1970's by Roger Penrose, named twistor diagrams.
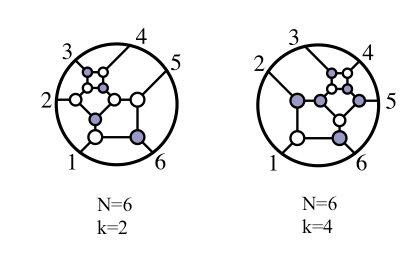
Figure 5: Twistor diagrams depicting an interaction between six gluons that can be used to derive a simple formula for the 6-gluon scattering amplitude.
According to Andrew Hodges:
"Twistor diagrams for scattering amplitudes have been explored since the early 1970s, when Roger Penrose first wrote them down. But the ideas underlying them suddenly received quite new attention at the end of 2003, when Ed Witten's twistor string model brought together twistor geometry, string theory and scattering amplitudes for pure gauge fields." (2)
The incredible simplicity and power of twistor diagrams gave them an air of mystery according to Arkani-Hamed: “The terms in these BCFW relations were coming from a different world, and we wanted to understand what that world was.” (3)
After over a decade of research with his collaborators, Arkani-Hamed showed how twistor diagrams could be pieced together to create a timeless, multidimensional object known as an 'Amplituhedron' (figure 6).
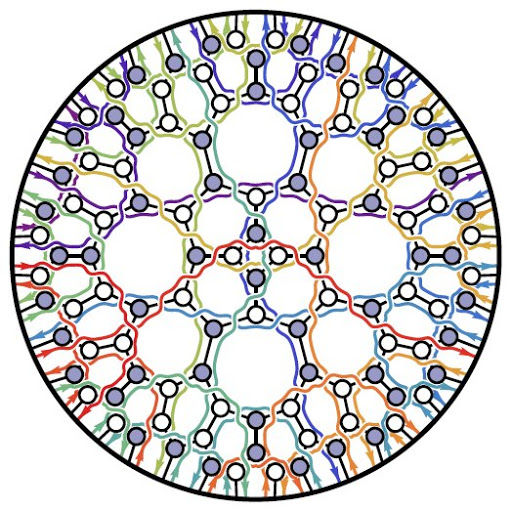
Figure 6: 'On-shell diagrams' are a new visual system for guiding and structuring the calculations of what happens when physical 'on-shell' particles interact, as opposed to the 'off-shell' virtual particles of Feynman diagrams.
The Amplituhedron has been described as an intricate, multi-faceted, higher dimensional jewel at the heart of quantum mechanics, a meta-level Feynman diagram completely new to mathematics.

Figure 7: Arkani-Hamed's hand drawn diagram of the amplituhedron
representing an 8-gluon particle interaction.
The amplituhedron is a geometrical representation of real particle data. The scattering amplitude can be derived from its volume and details of a particular scattering process determine its dimensionality and facets. This theoretical object enables simplified calculation of particle interactions with such astounding efficiency that according to Jacob Bourjaily, "you can easily do, on paper, computations that were infeasible even with a computer before." (4) Figure 7 shows the amplituhedron representing an 8-gluon particle interaction, an event that would require almost 500 pages of algebra using Feynman diagrams.
From Feynman diagrams to twistor diagrams and the discovery of the enigmatic amplituhedron, diagrams remain a powerful, albeit mysterious tool in theoretical physics. They permit information to be stored and shared with high fidelity, but they also mobilise and shape new knowledge by allowing intuition and rational thought to play a role in the creative process.

Figure 8: Dr. Richard Feynman during the Special Lecture:
the Motion of Planets Around the Sun, Caltech, 13th March, 1964.
The Palimpsest of Discovery
Diagrams in actions - the photography of Alejandro Guijarro

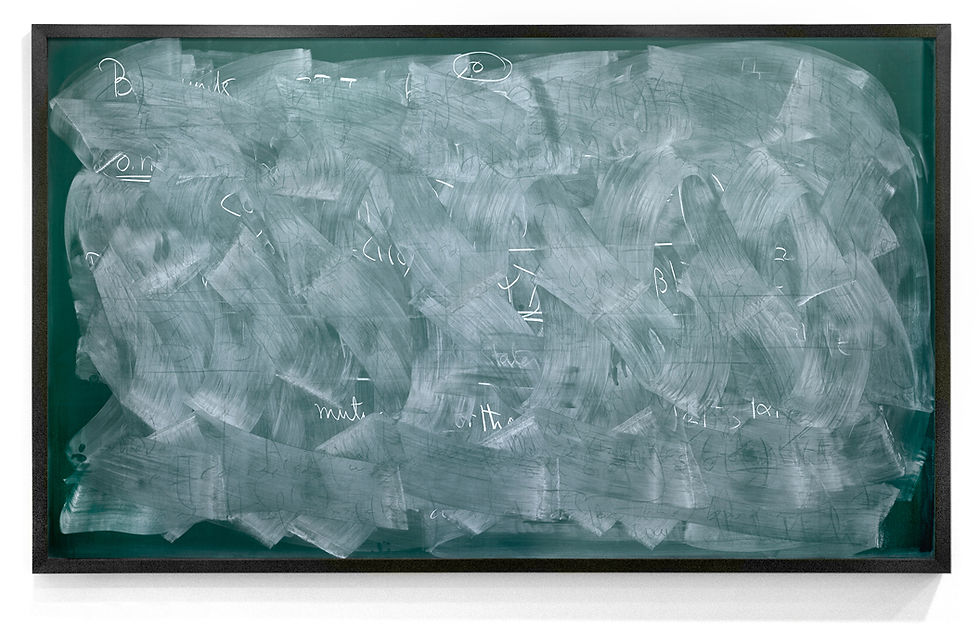
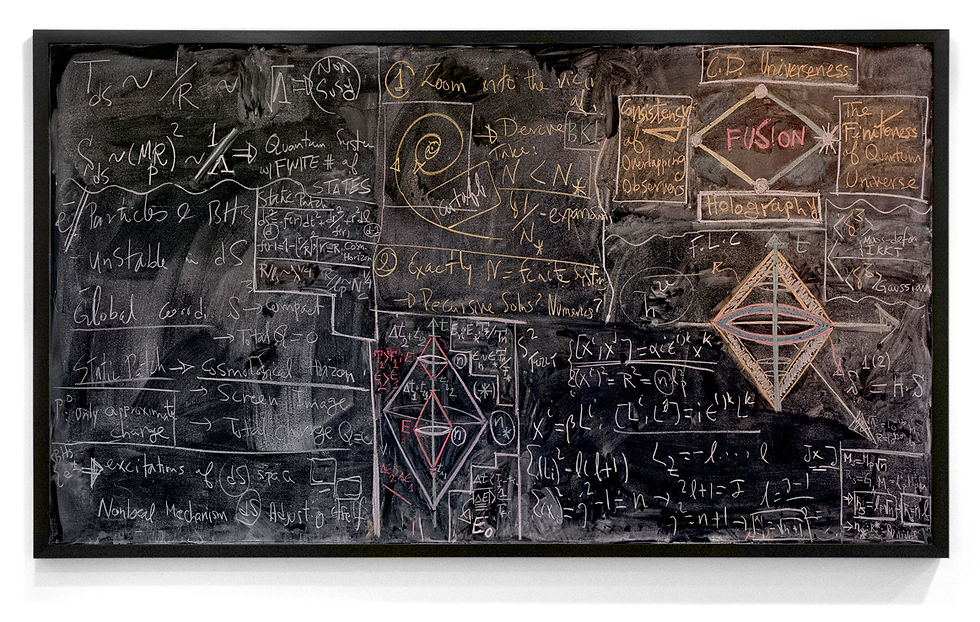
Alejandro Guijarro, STANFORD III, 2012, C-type print, 117 x 240 cm
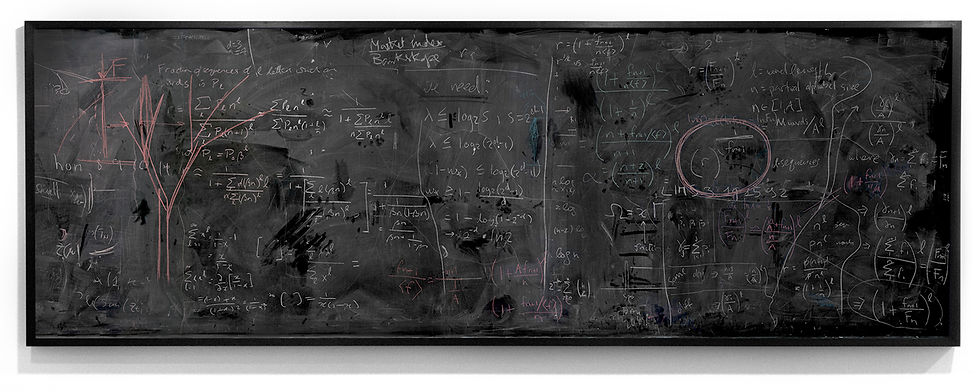
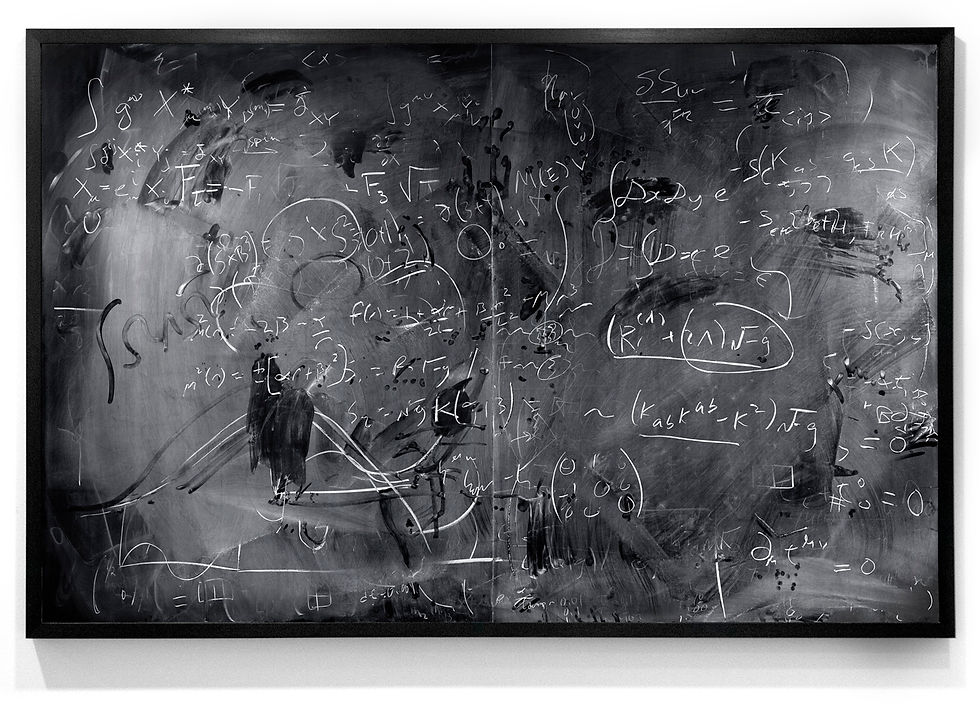
For his 'Momentum' series (2010-2013), Spanish artist and photographer Alejandro Guijarro traveled to several international academic institutions that specialize in quantum mechanics: CERN, Stanford, Berkeley and Oxford. In a form of documentation, Guijarro measured and photographed blackboards that he found in lecture theatres, meeting rooms and offices, then printed the images at a 1:1 scale.
The series highlights the transitive nature of diagrams at work during the creation and transmission of knowledge. It presents the process as a physically involved gestural performance, as various trains of thought are followed and erased to leave a blurred palimpsest.
'Momentum' is reminiscent of Marcel Duchamp’s project 'Unhappy Readymade', discussed in this previous Blog: The Diagrams of Geometry part II- A soggy book of diagrams as a wedding present from Marcel Duchamp. Both projects present us with a token of something lost - information and knowledge made manifest through the substrates ink, paper, chalk and board only to be subject to entropy.
In the case of 'Unhappy Readymade' it's the wind and rain which add entropy, in the case of Guijarro’s 'Momentum' it's the hand of the professor, janitor or the student armed with a blackboard eraser that return the arena of ideas to a tabula rasa.
For more information visit: AlejandroGuijarro.com

UC Berkeley II - C-type print, 112 x 236 cm, 2012
Cambridge V - C-type print, 117 x 200cm, 2011

Cambridge I - C-type print, 117 x 290 cm, 2011

Cambridge IV - C-type print, 119 x 300 cm, 2011

Cambridge III - C-type print, 100 x 101 cm, 2011

CERN I - C-type print, 100 x 180 cm, 2012
CERN II - C-type print, 100 x 180 cm, 2012
LIMS I - C-type print, 117 x 350 cm, 2015

Harvard I - C-type print, 160 x 122 cm, 2014
MIT III - C-type print, 112 x 183 cm, 2014

SLAC III - C-type print, 117 x 180 cm, 2012

Oxford II - C-type print, 110 x 150 cm, 2011

SLAC IV - C-type print, 117 x 243 cm, 2012

Stanford I - C-type print, 117 x 240 cm, 2012

Stanford III - C-type print, 117 x 240 cm, 2012
References:
1) C.F. Gauss quoted in Gauss zum Gedächtniss (1856) by Wolfgang Sartorius von Waltershausen
2) Andrew Hodges, Online at: http://www.twistordiagrams.org.uk/papers/
3) Arkani-Hamed, quoted in 'A Jewel at the Heart of Quantum Mechanics' by Natalie Wolchova, online
at: https://www.quantamagazine.org/physicists-discover-geometry-underlying-particle-physics-20130917/
4) Jacob Bourjaily, quoted in 'A Jewel at the Heart of Quantum Mechanics' by Natalie Wolchova, online
at: https://www.quantamagazine.org/physicists-discover-geometry-underlying-particle-physics-20130917/


Comments